How to Use Issuu Statistics to Track Your Content’s Performance
Sep 28th, 2023 by Kendal Rodgers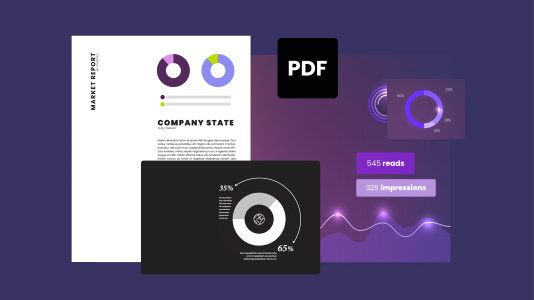
Welcome back to the Issuu blog! Today we'll walk you through how to utilize Issuu Statistics to gain valuable insights into the performance of your digital publications. These statistics provide crucial metrics such as impressions, reads, clicks, and more, helping you evaluate the reach and impact of your content.
Do you think your job ends with the Publish button? Think again. Analyzing your Issuu publications at pre-determined milestones – like days 1, 7, 15, and 30 – offers you a strategic advantage, making it crucial to iterating and improving on your digital content. So, it’s important not to skip or forget this step in your content marketing strategy, planning, and processes. To set you on the path to success, we’ve prepared a video with step-by-step instructions on how to get the best out of Statistics. But don't stop there — keep on reading to delve deeper and uncover strategies to take your content game to the next level. Take a look:
Getting Started with Issuu Statistics
Statistics Dashboard: To begin, log in to your Issuu account and click on 'Statistics' in the left-side menu. The Statistics dashboard is updated daily, offering you a real-time view of your publication's daily activity.
Publication Selection: To cater to both broad overviews and laser-focused analyses, the top of the Statistics page offers flexibility. At the top of the Statistics page, you can either view combined statistics for all your publications or hone in on a specific one, tailoring the data display to your current needs.
Key Metrics to Monitor
Impressions: Understanding the reach of your publication is vital. Impressions measure how many times your publication was served or displayed to your audience. This can include appearances as a thumbnail in someone's feed, search results, or on external websites where you've embedded it.
Reads: While impressions showcase potential reach, Reads dive into actual engagement. They’re tallied every time someone opens your publications and interacts with them by flipping through pages or zooming in. But here’s the catch: a quick glance doesn’t count. They are only recorded if a reader stays engaged for longer than two seconds.
Clicks: As the name suggests, this metric zeroes in on actionable engagement. This metric informs you about the number of clicked links within your publication, revealing areas of interest or effective calls to action.
Downloads: It’s not just about views or clicks. Keep track of how many times your publications have captivated readers enough for them to download them and share or revisit them offline.
Average Read Time: Time investment is a significant indicator of content value. This metric calculates the accumulated read time divided by the number of reads, giving you insights into how engaged your readers are.
Reading Devices: In our multi-device era, it's crucial to know where your content shines brightest. Be it mobile, tablet, or desktop, discover the types of devices your audience uses to consume your content.
Sources: Your content might be widespread, but where is it being consumed the most? The Sources metric reveals where readers access your content, whether it's through issuu.com, embedded publications, or Fullscreen Sharing links.
Additional Features Based on Your Plan
Download visual reports of your statistics in a sleek PDF or CSV format for all publications or individual ones and take your presentations to the next level. Specific Issuu plans also let you do the following:
Basic or Starter Plan: Access statistics for the past 30 days.
Premium Plan or Higher: Unlock historical statistics by specifying a date range or period. Enjoy more detailed metrics as well, including:
Links Statistics: Track the number of times links within your content are clicked.
Page-level Statistics: Identify the most engaging pages within a specific publication. This helps you tailor your flipbook's design and format for better visibility.
Readers around the World: Break down your audience by country, enabling you to target specific regions and gain deeper insights into your content's impact.
With Issuu Statistics at your disposal, you are now equipped to dive deep into the nuances of your digital publications, transforming raw data into actionable insights. Use these insights to refine your content strategy, engage your audience, and make data-driven decisions to grow your publication's reach. Start exploring your Issuu statistics today!