FROM THE EDITOR

Welcome to the first edition of Utility magazine. Foremost, Utility is a magazine by the utility industry, for the utility industry and I want to thank all of the associations whose support has made this issue possible.
Throughout the following pages you will read contributions from some of the major industry associations representing the sector, including the Water Services Association of Australia (WSAA), the Energy Networks Association (ENA) and Stormwater Australia (formerly the SIA). Utility is also working with a number of other associations and you can read more in our next issue.
We’ve also been fortunate enough to bring you contributions from Jemena, SPAusnet, Ergon Energy, Western Power, Sydney Water, Yarra Valley Water, ACTEW Water, Wide Bay Water, the NBN Co and the CSIRO. Together these organisations cover many facets of the engineering, construction and maintenance of water, sewer, gas, electricity and telecommunications utilities.
It is an exciting and challenging time to be in the utility industry. Developments in technology, policy and consumer expectations all combine to make this a period of enormous change. Thus we felt the time was ripe for a new forum to discuss these and other issues within the industry and to present various industry perspectives to a wider audience.
From a personal perspective, this publication has long
been a dream of mine and I am delighted to have finally made it a reality. The work done by utilities, often unsung and unseen, to deliver essential services to the public is no less than a cornerstone of our civilisation and a major factor unpinning our quality of life. I have always marvelled at the complexity and planning that goes into something which runs so smoothly that most people end up taking it for granted, and I hope this magazine will help to better recognise this heroic effort.
With the Utility suite of products we aim to be as forward-looking as the industry itself, and so present our readers with a publication that is fully integrated in print and online from the outset. Our quarterly print edition will be our flagship, presenting the best that we and the industry have to offer, and our comprehensive and fast-growing website (adapted to all devices of course) and email news will ensure that information is available when and where you need it. We also plan to roll out some new online products throughout 2014 and I will keep you updated as they are released.
Your feedback, suggestions and contributions are all welcome and can be sent to me via the contact details below. 2014 will also be a busy year for industry events, and as we will be in attendance at a great many of them around the country, I look forward to connecting with many of our readers there.
P: (03) 9440 5721
F: (03) 8456 6720
monkeymedia.net.au
info@monkeymedia.net.au
utilitymagazine.com.au
info@utilitymagazine.com.au
Editorial: Michelle Goldsmith
Sales: Cynthia Lim
Design: Sandy Noke www.sandynoke.com
ISSN: 2203-2797
Chris Bland Publisher and Editor
Monkey Media Enterprises ABN: 36 426 734 954 GPO Box 93, Melbourne VIC 3001
Published by February 2014 ISSUE 1
welcome
A WORD FROM THE ENA

At a time when the future of Energy networks is under significant scrutiny it has never been so important for there to be a diversity of views reporting on the issues of importance to the sector. The launch of Utility magazine is a timely new voice in reporting on the future of energy utilities. The Energy Networks Association (ENA) welcomes the opportunity to be a part of this first edition.
Australia’s energy networks provide the final step in the safe and reliable delivery of gas and electricity to households, businesses and industries. The twenty-six electricity and gas network companies ENA represents provide energy to virtually every household and business in Australia. ENA members own assets valued at over $100 billion in energy network infrastructure nationally and have over 13 million customer connections across the NEM.
The ‘disruptive’ impact of key trends in technology, costs, demand and consumer preferences are widely recognised and often the focus is on the major changes this represents for energy utility services and business models. With a customer focus, however, these trends are more of an opportunity than a threat to better network service outcomes. While the changes in customer demand and technology do create challenges, non network solutions such as embedded generation can help defer network augmentation driven by peak demand and battery storage and electric vehicles may improve the network load profile.
Energy networks are well placed to respond to these challenges and opportunities. 2014 promises to be a busy year for those interested in the energy supply chain. The development of a new Energy White Paper will be a key focus for industry and policy makers in the first half of the year.
The terms of reference for the Energy White Paper point to
important issues including policy and regulatory reform; the role of regulatory bodies; opportunities to drive the more productive and efficient use of energy; and the effect of emerging energy technologies and new energy sources.
These are also challenges that will be discussed at ENA’s biennial conference Energy Networks 2014. Taking place in Melbourne from 29th April to 1 May, Energy Networks 2014 includes panel debates featuring leading energy industry CEOs, Australia’s energy policy makers, regulators and advocates, and the CEOs of international alternative energy service providers.
Of particular note will be an International Keynote Address by recently appointed Chair of the Office of Gas and Electricity Markets (Ofgem) which regulates the monopoly companies that run the gas and electricity networks in the UK, David Gray. In addition, the former Victorian Premier, The Hon Jeff Kennett AC will be providing the Australian keynote address. As the architect of energy sector reform in Victoria, Mr Kennett’s address on the experience in driving these reforms and insights into the role of Governments in leading reform will be a timely intervention in the conversation about the future of energy reform in Australia.
Energy Networks 2014 will highlight the changes being experienced by the sector, and the opportunities this represents. The ENA looks forward to diverse industry perspectives on these and other issues, through Utility magazine.
John Bradley Chief Executive Officer –Energy Networks Association
UTILITY • FEBRUARY 2014 WWW.UTILITYMAGAZINE.COM.AU 2
utilitarian by design
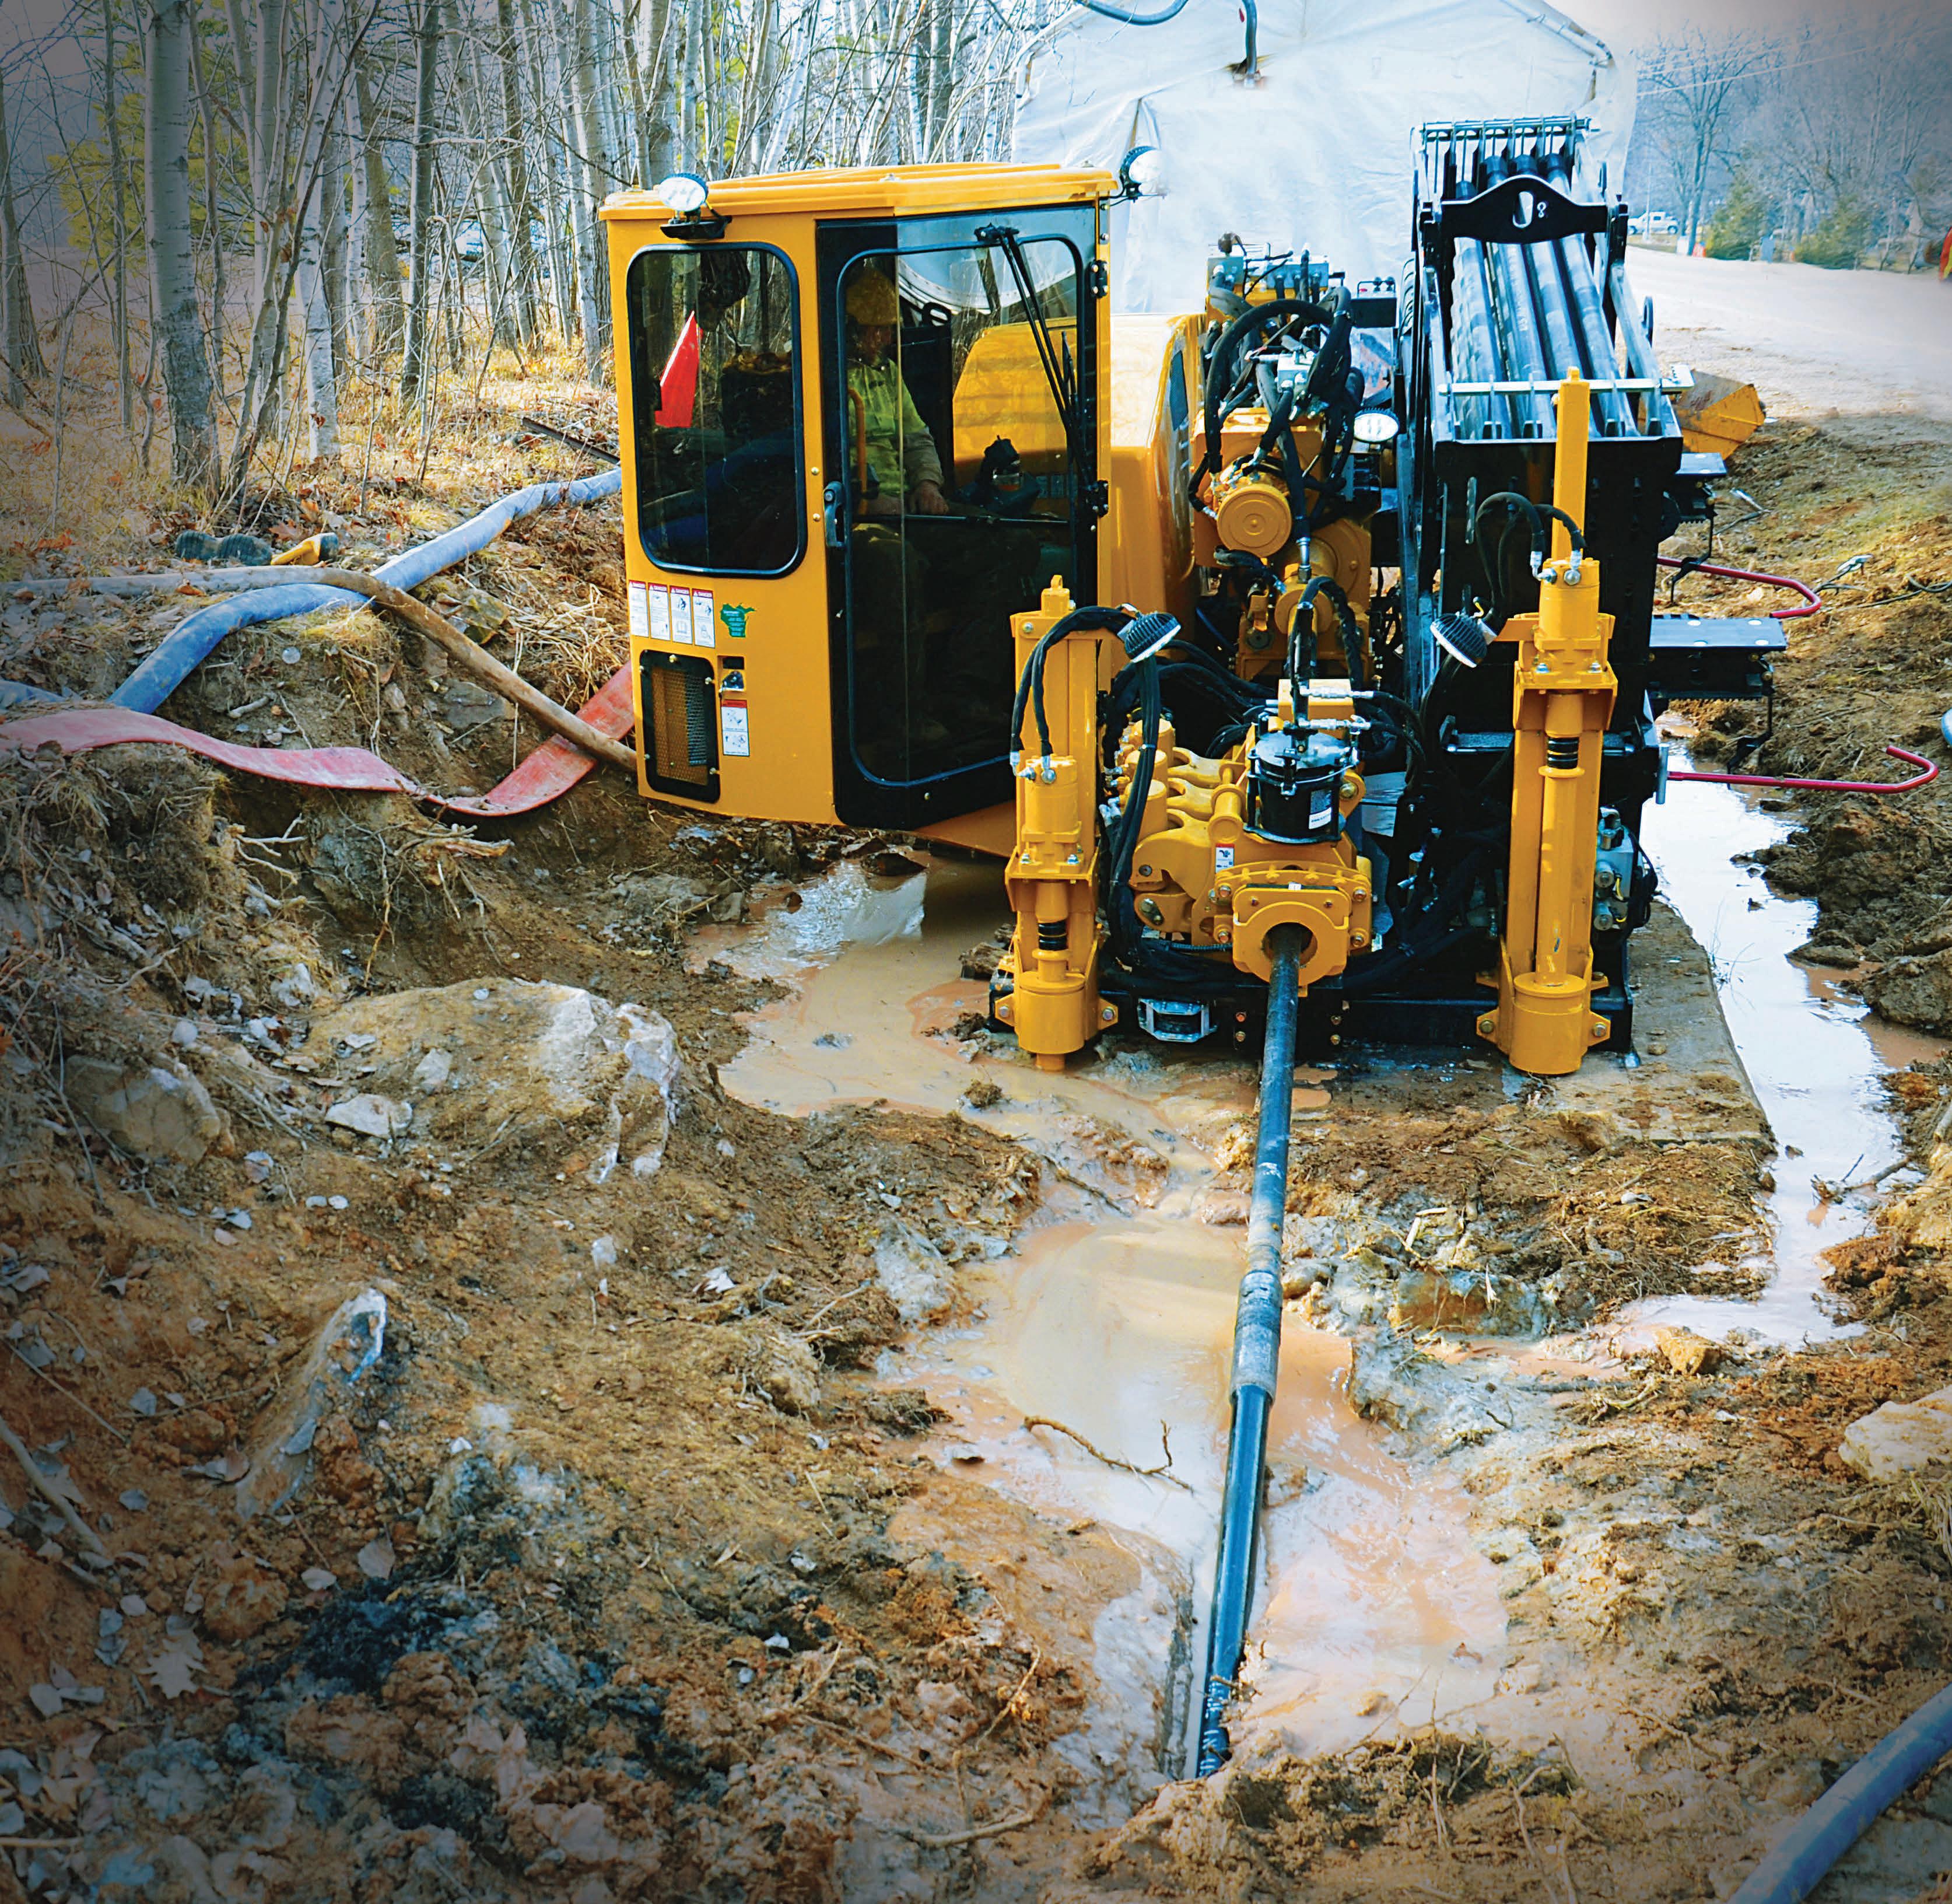
All day, every day, any conditions. The Vermeer D36x50DR excels in any conditions you can put to it.
Boasting 38,000 lbs of thrust/pullback, a genuine 70 gpm fluid flow and the ability to eat up both dirt and rock for hundreds of metres, the D36x50DR brings unrivalled versatility to directional drilling.
Removable inner rods featuring industry exclusive threaded joints means you can switch an entire basket of rods from rock to dirt applications in around 15 minutes―or quickly swap an empty basket for a full one for those long shots
These are but a few of the reasons the Vermeer D36x50DR is taking the utility installation world by storm.
Contact your local Vermeer dealer today to learn more.


QLD / NSW / VIC / SA 1800 620 720 www.vermeer.com.au WA / NT 1800 195 558 www.vermeerwa.com.au Vermeer and the Vermeer logo are trademarks of Vermeer Manufacturing Company in the United States and / or other countries. © 2013 Vermeer Corporation. All Rights Reserved.

FOCUS ON: WATER/SEWER
Sydney Water is Australia’s largest water utility. This issue we talk to Managing Director Kevin Young about the past, present and future of Sydney Water, and the circuitous path that led him to his current role.
FOCUS ON: ELECTRICITY/GAS
Jemena is one of the major players in Australia’s energy industry, covering both gas and electricity, and transmission and distribution. We caught up with Managing Director Paul Adams, who was also recently appointed as Chairman of the Energy Networks Association (ENA) to ask him about both Jemena and his own career.


6 14 24 51 62 56
CONTENTS
UTILITY LOCATING After you dial, but before you dig ....................... 24 When carrying out any excavation calling Dial Before You Dig (DBYD) is only the first step. Opinion: the triumphs and pitfalls of the new AS5488 standard 30 By Anthony Johnstone, Access Detection NBN NBN: the state of play ................. 51 NBN progress map 54 SEWER Servicing the Mernda and Doreen growth area ............. 56 Lessons learned on a first microtunnel 60 WATER/DAMS To dam or not to dam .................. 62 Cotter Dam enlargement 69 UTILITY • FEBRUARY 2014 WWW.UTILITYMAGAZINE.COM.AU 4


ELECTRICITY
SCADA helps Ergon improve network reliability ........................
Queensland regional electricity distributor Ergon Energy has improved network reliability and is future-proofing its network.
SMART GRID
Future Grid Forum releases Change and Choice......................
For over a decade, Western Power has been undertaking an extensive program to put powerlines underground throughout Western Australia.

Historically high retail electricity prices, widespread deployment of solar panels, and declining aggregate peak demand and consumption in most states have changed projections of how the electricity sector may develop in the future. To take a fresh look at the various possibilities and their implications the Future Grid Forum has been working for 18 months to develop plausible alternative scenarios, review their associated risks and challenges and the options for responding.
36 46 32 GAS Directional drilling brings gas to the regions
32 Construction
is
gas to the Victorian town
north of Bendigo.
........................
work
currently underway to connect reticulated natural
of Huntly,
36
Power
40
goes underground in the west
46
Ensuring quality ........................... 72 2014 is shaping up to be a big year for Stormwater
the new identity of the Stormwater Industry
of Australia. In each issue Editor’s welcome .................................................. 1 A word from the ENA .......................................... 2 News briefs ......................................................... 21 Product showcase .............................................. 77 Advertisers’ index .............................................. 80 Editorial schedule .............................................. 80 The way we were ...................................................... 74 History: In this issue we talk to Chris Geehman. February 2014 ISSUE 1 WWW.UTILITYMAGAZINE.COM.AU UTILITY • FEBRUARY 2014 5
72 STORMWATER
Australia,
Association
KEVIN YOUNG MANAGING DIRECTOR
Sydney Water is Australia’s largest water utility. In this issue we talk to Managing Director Kevin Young about the past, present and future of Sydney Water, and the circuitous path that led him to his current role.
THE PATH TO SYDNEY WATER
When he first started in the water industry, Kevin never saw himself ending up at the head of Sydney Water.
“I actually started by working in the gangs laying water and sewer mains, working with electricians doing pump maintenance transformer and was a labourer for the crews,” he says.
“I was a cadet at Hunter Water and they put their cadets full time through university. I worked for Hunter Water immediately afterwards and I didn’t like the water industry back then because it wasn’t efficient or as focused - it was more old world - so I left them and I joined the private sector. But interestingly, just at the time I left Hunter Water in the early 1980s, Dr John Patterson came in. He was one of the great leaders of the water industry and he changed the water industry to focus more on customers, including
the introduction of user-pays.
“I stayed with the private sector and I worked overseas, but then I started to notice this groundswell of change in the water industry and I really liked what I saw. I had worked across a range of engineering disciplines when I got this amazing opportunity to come back and work at Hunter Water in the early 1990s as their organisation’s first asset manager. Before then the water industry was all about constructing things but now people had realised our assets are starting to reach an age where we need to consider how we get the most out of our assets and what’s the best maintenance we can do. That was just a wonderful opportunity to come back into the industry because it touched the whole business.
“The MD at that time was Dave Evans – he was a bit of a cricket fan and he gave me this incredible job


UTILITY • FEBRUARY 2014 WWW.UTILITYMAGAZINE.COM.AU SOME OTHER STAT HERE DATA HERE 6 SEWER WATER
FOCUS ON
WWW.UTILITYMAGAZINE.COM.AU UTILITY • FEBRUARY 2014 Article title SECTION 7
Kevin Young, Sydney Water
title which was ‘The Twelfth Man’. One day I said to him, ‘What’s the twelfth man?’ He said ‘We’ve got the executive team and what you are is that you come in as the utility player if I need someone to bowl, bat or field’. So I had this incredible experience of doing a lot of relief across the business. So I did customer service, operations, strategic planning, government relations, HR, waste water treatment – it was just a wonderful time.
“Then I was Company Secretary and when David Evans got the job at Sydney Water and I was asked by the board, on one of those great days to be Managing Director at Hunter Water. I said I’d be delighted.
“I’d been there for seven years as Managing Director when Kerry Schott left Sydney Water and I applied and was absolutely delighted to get the job. I think that was a dream come true.”
It is notable that the last three Managing Directors at Hunter Water have all become Managing Directors of Sydney Water; Paul Broad, David Evans and now Kevin, who has his own thoughts on why this might be the case
“I think it’s almost like a pilot for the role because it’s a smaller organization – it’s a ninth the size of Sydney Water, but because it’s so much smaller if you’re Managing Director or Executive Manager you’ve got to know every part of the business. In bigger organizations you have dedicated teams in each of the areas and silos tend to form. In smaller organizations you have to understand all parts of the business.”
Reflecting on the differences between the two organisations, Kevin noted that, “geographically Hunter Water is a similar area, but it’s just spread out so wide. So there’s a lot more vulnerability in the Hunter system than there is in the Sydney system because you’ve got long, single pipes running long distances. We had 450 staff, so when we wanted to talk about
THE
strategic direction and new plans in Hunter you could actually talk to the business. But in Sydney, when I first came down here, we had 3000 people and spread out over an area down to the Illawarra and out West. The huge Sydney region – it’s a big exercise. I think the internal communication is a lot harder in Sydney Water. We’re doing really well on that, trying to use things like internal social networks. But I spend a lot more time getting out and about and seeing the different parts of the business than I ever did in Hunter.”
THE LAST 30 YEARS
When Kevin first started in the water industry, houses didn’t even have water meters. Kevin recalls that when Dr John Patterson first introduced user-pays in the Hunter “People marched in the streets to say that they didn’t want to pay for the water that they were using. It didn’t have a commercial focus and it wasn’t respected. Now people see it as a valuable commodity.”
Another change has been the shift from monolithic utilities, to smaller
organisations that outsource many functions. Kevin reflects that when he began utilities “were run as in-house groups and we did everything.
“So there was very little that we partnered with the private sector. If we wanted to do investigation, design, even construction – everything was in-house without competition.
“What we’ve seen now is just a dramatic change and I think you can see that in the numbers. Sydney Water going back to when I first came out of uni around 1980, had 14,000 employees, today we’ve got 2,450.”
Reflecting on the changes in equipment, Kevin recalled, “Pumps – they were great, slow, big pumps that would last forever and I think we’ve moved now to faster speed pumps and more efficient – the cost has come down.
”When I first started in the industry someone told me our oldest pump was something like a hundred years old. I said that was not possible. But while it was the same pump it had its motor replaced about eight times and it’s had its impeller replaced. It’s like your grandfather’s axe - it’s the same
UTILITY • FEBRUARY 2014 WWW.UTILITYMAGAZINE.COM.AU 8
FOCUS ON
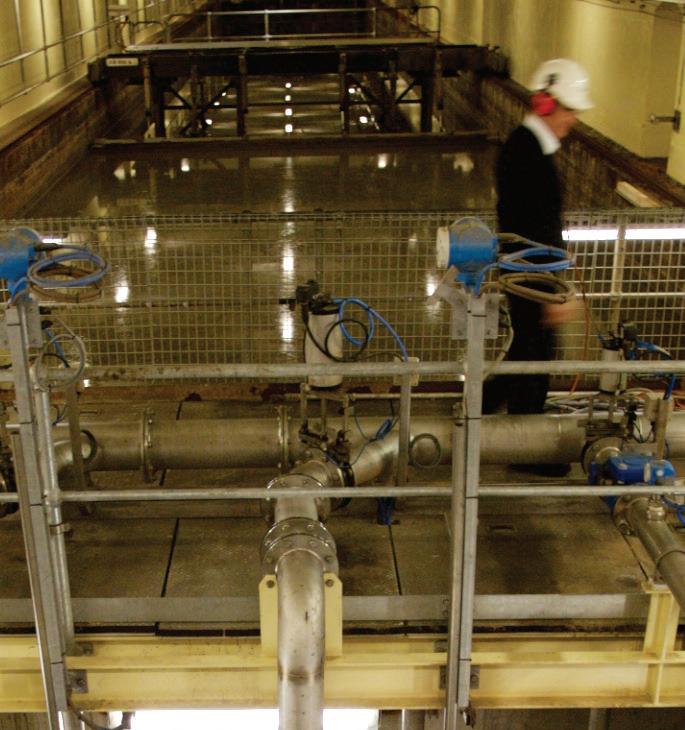
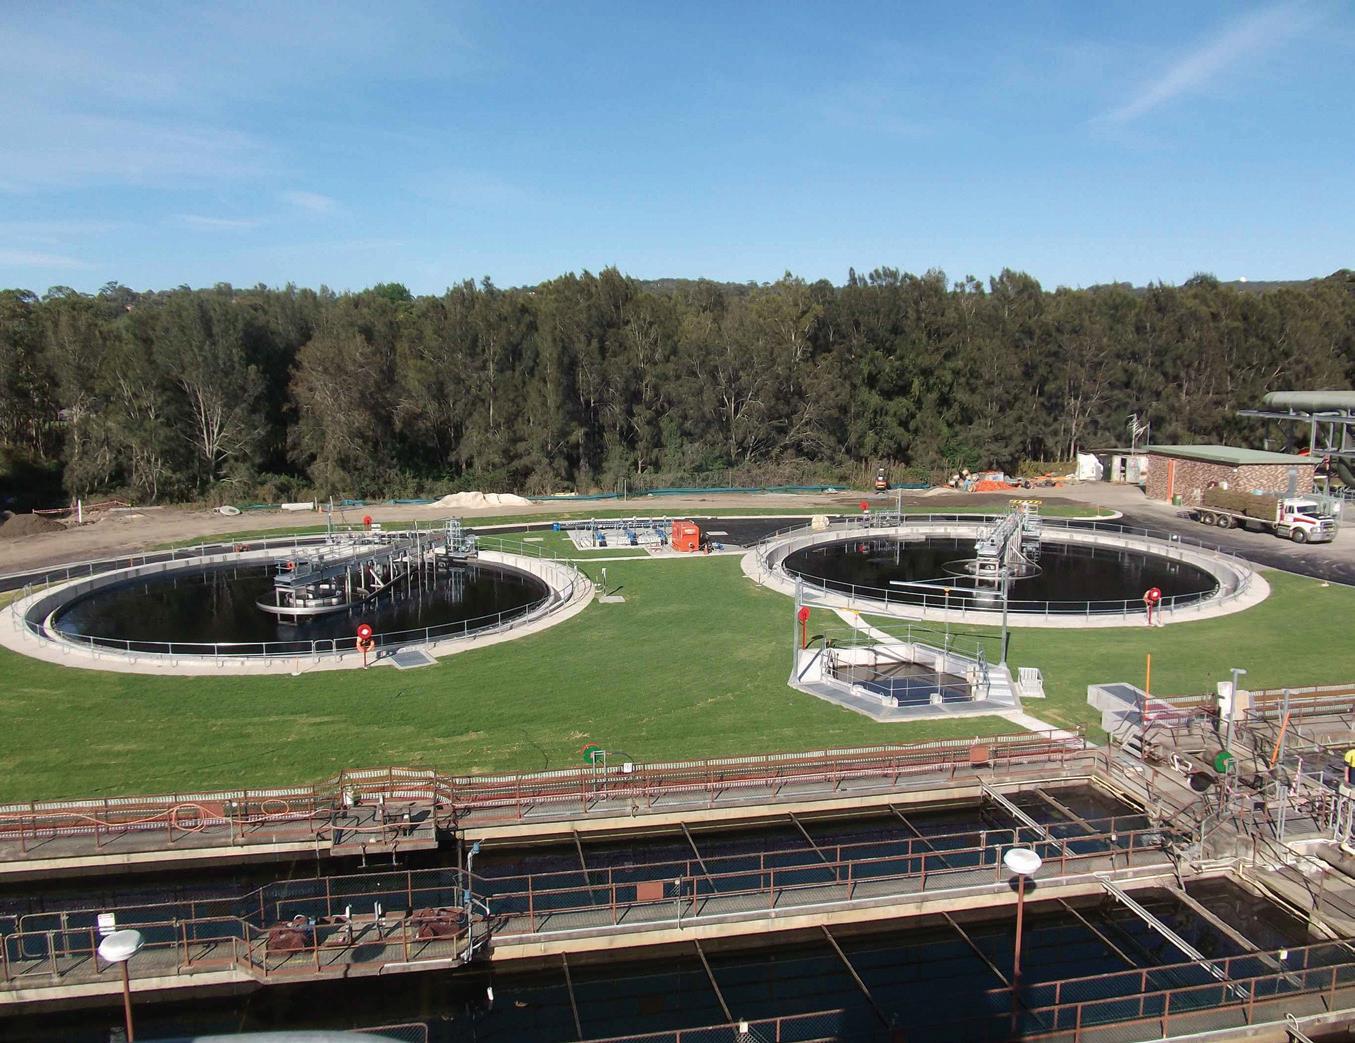
UPGRADED INFRASTRUCTURE AT WARRIEWOOD WASTEWATER TREATMENT PLANT WHICH WAS COMPLETED IN APRIL 2013

one he had, it’s just had ten handles and six heads!”
Improvements in information and communications technology have also saved an enormous amount of time and resources, “When I was a graduate they used to have to send people out on runs to check gauges on the sides of the reservoirs to see how full they were and come back into town to ring up and say the system is working all right. Now of course it’s completely computerised –the whole Sydney Water network runs automatically, all pumps – if a pump fails the computer system works out the next best pump to put in. It’s trying to optimise operations costs, make sure we’ve got water – it’s fantastic what we can do today, it’s incredible.”
THE NEXT 30 YEARS
Having seen the staggering pace of
change of the last 30 years, Kevin expects the water utilities of the 2040s to be dramatically different again.
“With climate variation coming in and the challenges that we’ll face with bushfires and sea level rises and also more storms – we will need to be more resilient in that area. The world will move itself to put a cost on energy and carbon dioxide and the water industry will move towards producing more and more energy from our waste water networks.”
This is an area in which Sydney Water is already well progressed. “Our major waste water treatment plants now feed into tanks where methane gas is produced anaerobically. Then we’ve got co-generation facilities that generate energy on site. We have the capacity at the moment to generate up to 20% of our energy needs through cogeneration and hydro power
at the moment.
“We were commenting the other day that in the past Sydney Water would run campaigns and tell people not to put oil and fat down the sink. While in the future we would run campaigns to say we want you to put oil and fat down the sink because we can generate energy from it.”
“Another big change is the growing population. Sydney’s going to have something like another million people within that time frame. There will be more need for integrated systems, water waste water, recycled water. People will want greenery in the cities, they’ll want some urban gardens, they’ll want water to be part of their cities.”
Continuing improvements in communications will also bring out more change, “Everyone will be on smart meters. You will be able to get
WWW.UTILITYMAGAZINE.COM.AU UTILITY • FEBRUARY 2014 SECTION 9
Kevin Young, Sydney Water
FOCUS ON
THE DRINKING WATER RESERVOIR IN THE ROUSE HILL GROWTH AREA
Kevin Young, Sydney Water
information about how your house is using water today, this last two minutes, this five minutes – what the trend has been. It will send you an sms if you’re outside certain ranges so you can try and understand why you’re using water, whether you have a leak.”
Kevin speculates about where may lead, “Could you actually have cash for water, the same as telecommunications? Pricing plans – would you actually say that people could pre-pay for water and that’s possible or do they get a cap – a certain allowance? Do they pay for a certain drought security, different arrangements – there’s a lot of options that come in. Just imagine if you went up to your cap and – in my household if I go to my cap on the internet then the internet slows, I wonder if that would happen in water.”
Could water utilities in the future more closely reflect changes already seen in energy and telecommunications? “In the future there’ll be a lot more competition in water so you’ll get a lot more wholesale water suppliers coming in, competing, storm water, recycled water. I suspect in the future it could be that you could get private sector retailers coming in. I don’t know if it’ll go the same way as energy, but it’s possible. Those new retailers will want to differentiate themselves from others so they’ll be trying to give you different plans based on what they think a modern generation will want. When I say ‘modern generation’ I don’t mean the modern generation now, I mean the modern generation in the future – in 30 years’ time. That will be dramatically different, that generation will understand technology – they’ll understand social networks, what the deals are and how to get the best value out of it.
“The overall big trend is that places like Sydney Water we’re not plumbers, we’re planners and that’s what we’re seeing overseas. You’ve got to be really focused on strategic planning and enhance that Liveability in cities is
Generally Springwood uses 4 million litres of water a day and on the day of the Springwood Fires it used 28 million litres of water. So the guys reconfigured how to get water from different locations to make sure that we could provide water for that community for the fire fighting.
going to be a key trend overseas and for us.”
Another key to the future of the sector will be the ability to attract and retain the right people. Kevin explains how Sydney Water is managing with this, “The people that work for us love to work for us so we don’t get much turnover, but what we’re doing is putting on a lot of graduates and we’re finding that we’re attracting graduates of amazing calibre. So I’m really pleased with our graduate program, it’s really popular and I think, in recent years, we’ve had a significant number of graduates that have joined the organization.”
The Sydney Water graduate program is a three-year program and includes civil, chemical, mechanical, environmental and electrical engineering as well as environmental science, commerce, business and economics, accounting, communications and marketing. Eigtheen started on the program in 2013 and 2012 and twelve will start in 2014. The average retention rate is 92%.
OUT OF SIGHT
When asked what he believes is the main thing about the industry that the general public isn’t aware of, Kevin said: “The scale and complexity of the network that we run and what’s involved in giving them the clean water and taking away their waste water and treating it in a very sustainable manner. We’ve got 21,000 kilometres of water mains, and slightly more in waste water mains (24,000
kilometres). If you stretch our drinking water network end to end it will go to America and virtually back. We’ve got this incredibly complex network with all of these reservoirs and pumping stations and I think what people don’t understand is how well we manage risk and how we try and balance investing in new assets and maintenance and all the scheduling that we do. How do we make sure that all of the pumps, the waste water treatment plants, the water treatment plants – they’re all hitting their targets. It seems seamless and easy, but it’s far from that, there’s a dedicated group of people that really drive all that hard.”
Does Kevin think it matters that people often take this service for granted? “I think that’s the old proverb isn’t it? You only know the value of the well when the well runs dry. If you’re without water for an extended time period then you would think wow, this is an incredible product that we need. Luckily that doesn’t happen, but I always say for $2.17 a kilolitre you get a tonne of food grade water, world class standard, delivered to your taps and the appliances in your house on a virtually continuous basis and I think that’s great value.”
“The recent fires – the organization just was fantastic in meeting unexpected needs for water during those fires.
Generally Springwood uses 4 million litres of water a day and on the day of the Springwood Fires it used 28 million litres of water. So the guys reconfigured how to get water from different locations to make sure that we could
UTILITY • FEBRUARY 2014 WWW.UTILITYMAGAZINE.COM.AU 10
ON
FOCUS
THE BONDI SEWAGE TREATMENT PLANT WAS THE FIRST SEWAGE TREATMENT PLANT ATTACHED TO A MAJOR OCEAN OUTFALL SEWER IN NSW AND THE FIRST CONNECTED TO A DEEP OCEAN OUTFALL IN AUSTRALIA. IT WAS THE LARGEST SEWAGE TREATMENT PLANT IN AUSTRALIA AT THE TIME OF ITS CONSTRUCTION
provide water for that community for the fire fighting. We were getting water in dams so that the helicopters could pick it up.”
Kevin has a keen eye on what other utilities are doing, both here and overseas and is always to new innovation, “There’s some great utilities here and overseas that are doing fantastic things with cultural change within the business, really focusing on customer service and getting customers involved.
“We’ve been watching some of the UK utilities like South West Water and Thames Water that have smart phone apps where you can pay your bill on your smartphone or find out what the storages are or report a leak in the street. I’d love some of the stuff as the new technology in what people are doing to link with customers – it’s fantastic.
“If you see a leak in the old days you’d go back to your house and you’d ring up and get through and then
you’d try and describe to the person on the phone – I’ve got a leak. They’d say, where is it? Well I think I think it’s Smith Street, but it could be Gold Street – but with the app you could take a photo of it, it’s geospatial so it knows exactly where the leak is. When we’re trying to do triage – if you talk to a customer and say well how big is the leak? Is it an emergency? They’re trying to tell you how much water is coming out of it, but when you see the photo you can triage it immediately.”
Kevin believes that there is also much that overseas utilities can learn from Australia, especially in areas such as innovation and research “We’ve got a major project that a number of water utilities are involved in predicting pipe failures through critical water mains. We are creating a new tool to predict a critical failure before it occurs and we’re partnering with three universities, UTS, University of Newcastle and Monash. It’s attracted so much attention that the
Water Research Foundation has become a major research partner because they believe that the work that’s being done here in Australia has got worldwide implications.”
MEMORABLE MOMENTS
When asked which achievements in his long career he is most proud of. He immediately recalls a time at Hunter Water where he was tasked with improving safety. “I put a lot of personal commitment into that work with a great team and we got our safety stats down. I’ve always thought that that improvement potentially could have saved someone’s life and definitely stopped people being injured. I think we went for no lost time injuries in Hunter Water for period of 18 months which was amazing.”
Another memorable career moment for Kevin was his time with Seattle Public Utilities, in the northwestern USA. Working with the Managing
WWW.UTILITYMAGAZINE.COM.AU UTILITY • FEBRUARY 2014 SECTION 11
FOCUS ON
Kevin Young, Sydney Water
Kevin Young, Sydney Water

THE NORTHERN BEACHES STORAGE
PROJECT COMPLETED IN LATE 2013 INCLUDES A WATER AND BULRUSHES DESIGN INSPIRED BY THE CURL CURL
Director, Kevin implemented a change management program over a period of 10 months. “I really put my heart and soul into that – we drove great efficiencies in the business. On the last day, when I was leaving, there was a major executive meeting on and I just had to go to the airport. As I stopped to take my bag and walk out of the door, it must have been 40 people, the entire room stopped the conversation and they stood up
and they started to clap. That was a sort of spontaneous response that I look back on meaning that I made a difference in their lives.
“And at Sydney Water what we’ve done in driving efficiencies in the business has been nothing short of amazing. I think we went from bills that were going up significantly to this current price path – bills are going up by less than inflation. So we’ve done some great things there,
the organization is really caring about affordability for customers.
“I think the water efficiency program that’s been run in Sydney has been spectacular. It’s often said that we use the same water today that we did in the 1970s and we’ve got a million more people. So they’ve really done well here in water efficiency.”
A critical role like this requires both a lot of hard work, but also maintaining a healthy balance. So what is involved in
UTILITY • FEBRUARY 2014 WWW.UTILITYMAGAZINE.COM.AU 12
FOCUS ON
LAGOON

a typical day for Kevin. “I’m an early riser so I tend to get up by 5:30am. I get into work early and ride a bike in couple of days a week to and from where I live about 12 kilometres away.” The workday starts at about 6:30am, “I find that a really great time for me to do my top ten things I want to do in the day and plan the day out and knock my emails over. Then the day is pretty well full on then, the day is chock-a-block with meetings and working with different
teams or talking at different functions.” Kevin manages to still get home in good time for dinner with the family, and will put in an hour at the gym and work as needed in the evening.
In a career that’s taken him from the labour gangs laying pipe to the top of Australia’s largest water utility, one constant is his passion and enthusiasm for the sector. So what is it about the water industry that inspires him so much? “That we’re the essence of life
for our community. We have a life giving product that people just turn on the tap to get. Then we take their waste away at the press of a button. I like the fact that we do that great job and often people don’t think about it. But the people in this industry– that’s what they care about. They love the fact that we’ve been around for 125 years and that we’ve got a big future to keep that going. People in the water industry love being part of the business.”
WWW.UTILITYMAGAZINE.COM.AU UTILITY • FEBRUARY 2014 13
PIPELAYING IN THE SOUTH-WESTERN GROWTH CENTRE
SECTION
FOCUS ON
Kevin Young, Sydney Water

14 UTILITY • FEBRUARY 2014 WWW.UTILITYMAGAZINE.COM.AU GAS ELECTRICITY
FOCUS ON
PAUL ADAMS MANAGING DIRECTOR JEMENA

GAS TRANSMISSION
Can you tell us briefly about Jemena’s activities in gas transmission?
We operate approximately 1,500 kilometres of gas transmission pipelines and associated facilities throughout Queensland, New South Wales and Victoria.
Assets we 100% own and manage include the Eastern Gas Pipeline (EGP), the VicHub Interconnect Facility, the Queensland Gas Pipeline (QGP) and the Colongra Gas Storage and Transmission facility.
The EGP is a key supply artery between the Gippsland Basin and New
South Wales and it supplies more than half the gas consumed in New South Wales. The VicHub is an interconnect facility situated at the Longford Compressor Station. VicHub enables gas to flow bi-directionally between the Eastern Gas Pipeline and the Victorian gas transmission system
The QGP links the Wallumbilla gas hub in south central Queensland to large industrial gas users in Gladstone and Rockhampton.
Jemena designed and built the Colongra Lateral Pipeline in 2008 which has been described as one of the most unique and innovative projects
15 WWW.UTILITYMAGAZINE.COM.AU UTILITY • FEBRUARY 2014
Paul Adams, Jemena
of its kind in Australia. This pipeline delivers gas to Delta Electricity’s 600MW gas-fired peaking power station and also stores enough gas to allow the power station to run at full capacity for five hours.
Do you think that the large LNG projects in Queensland will have a major impact on supply in New South Wales? With more gas being drawn to the north, several media reports suggest east coast prices will rise and potentially spike in the short term. If yes, do you have any views about a possible solution?
Jemena agrees with the view that the Queensland LNG projects will have an impact on domestic supply in the next few years. Domestic demand is competing with LNG exports, which in turn could result in significant reductions in gas flowing from the Cooper Basin to New South Wales. This, coupled with community concerns about coal seam gas (CSG), could impact on the development of new sources of gas supply in NSW.
The challenge – not just for New South Wales but for the whole of the east coast of Australia – is to ensure that there is access to as broad a supply of gas as possible from as many sources as possible. This way Australia can not only benefit from the export of gas to overseas markets but also continue to enjoy the competitive advantage of using natural gas in domestic markets. This means establishing efficient approval processes for gas developments and not adding onerous layers of approvals.
Jemena believes that it is important to bring the most cost-efficient delivered gas to market. We consider expanding the EGP - to increase the flows of gas from Victoria - will be a key part of meeting demand for natural gas. Jemena is working on solutions with customers to expand the EGP to enable more gas to flow north to meet any shortfall.
There has been some media
comment regarding the need for a national gas grid in Australia. Do you have a view about this?
As Jemena’s gas transmission assets are on the east coast, I will confine my comments to the east coast grid.
An interconnected east coast gas transmission system would provide supply solutions to help manage current and future market changes. Specifically, there is an opportunity to introduce greater competition and efficiency to the transmission market on the east coast of Australia.
A directly interconnected east coast would not only facilitate improved and additional flows from existing basins but would also open up new sources of supply to the New South Wales market.
Gas prices are rising because of the increased costs of getting gas out of the ground and because there appears to have been a shortfall in supply for a period of time around the commissioning of the Gladstone LNG facilities.
Increasing gas supply and then bringing this gas to market is critical to bringing downward pressure to gas pricing. An interconnected east coast gas transmission system could have a key role to play in ensuring that all players in the Australian gas industry – from power generators and manufacturers to small businesses and households – are able to benefit from access to this abundant resource.
Australia has a plentiful supply of natural gas so we will need the right policies to ensure all Australians benefit from both the export of natural gas and the domestic use of natural gas.
GAS DISTRIBUTION
Can you tell us briefly about Jemena’s activities in gas distribution?
Jemena owns, operates and manages the 25,000 km long Jemena Gas Network (JGN) which distributes natural gas to over 1.1 million homes and businesses in Sydney, Newcastle, Central Coast and Wollongong as well
Australia has a plentiful supply of natural gas
so we will need the right policies to ensure all Australians benefit from both the export of natural gas and the domestic use of natural gas.
as to over 20 country centres including those in the Central West, Central Tablelands, South Western, Southern Tablelands, Riverina and Southern Highlands regions of New South Wales.
Jemena also owns 50% and strategically supports ActewAGL gas networks in the ACT.
What are some of the challenges facing you as the owner of gas network that distributes gas to 1.1 million customers?
Our major challenge is to deliver safe, reliable supply and affordable gas to our customers in the face of growing customer numbers and growing demand for gas. Each year we add about 30,000 new customer sites to the Jemena Gas Network.
As we have seen in various parts of the world, there is significant risk to supply reliability and public safety if gas networks are not replaced and well maintained.
When it comes to reliability of supply, we have succeeded in reducing gas supply interruptions over the past five years – and shown an improvement of 33%.
When it comes to integrity/safety of supply, we have been able to successfully reduce reported gas leaks on the network – with an improvement of 10.9%.
UTILITY • FEBRUARY 2014 WWW.UTILITYMAGAZINE.COM.AU 16
FOCUS ON
This in part reflects the fact that we are investing over $800 million over five years to upgrade/replace and extend the Jemena Gas Network. In the past five years we have laid more than 1,100 kms of new mains in New South Wales.
There is also the challenge of trying to make gas accessible to the 300,000 homes and businesses in Sydney alone which currently do not have a gas main in their street and therefore cannot be connected to the gas network.
Getting the balance right between reliability and price is always a challenge, and we will be engaging actively with key stakeholders on this as we prepare for our next access arrangement (which begins in 2015). We are very conscious of the impact that rising energy prices are having on customers, and this is particularly important in the current environment where wholesale gas price are rising significantly.
ELECTRICITY DISTRIBUTION
Can you tell us about Jemena’s activities in electricity?
Jemena owns and manages the Jemena Electricity Network (JEN) which delivers electricity to over 320,000 homes and businesses in north-west Melbourne. We partially own (34%) the United Energy network (UE) which delivers electricity to over 640,000 homes and businesses in south-east Melbourne and the Mornington Peninsula and 50% of ActewAGL electricity network in the ACT.
There has been much media commentary about rising electricity prices. Does Jemena have a view about what can be done about this from a distributor’s perspective and the perspective of the 320,000 customers of the Jemena Electricity Network?
Jemena understands the pressure that customers are facing as a result of rising prices. The way our
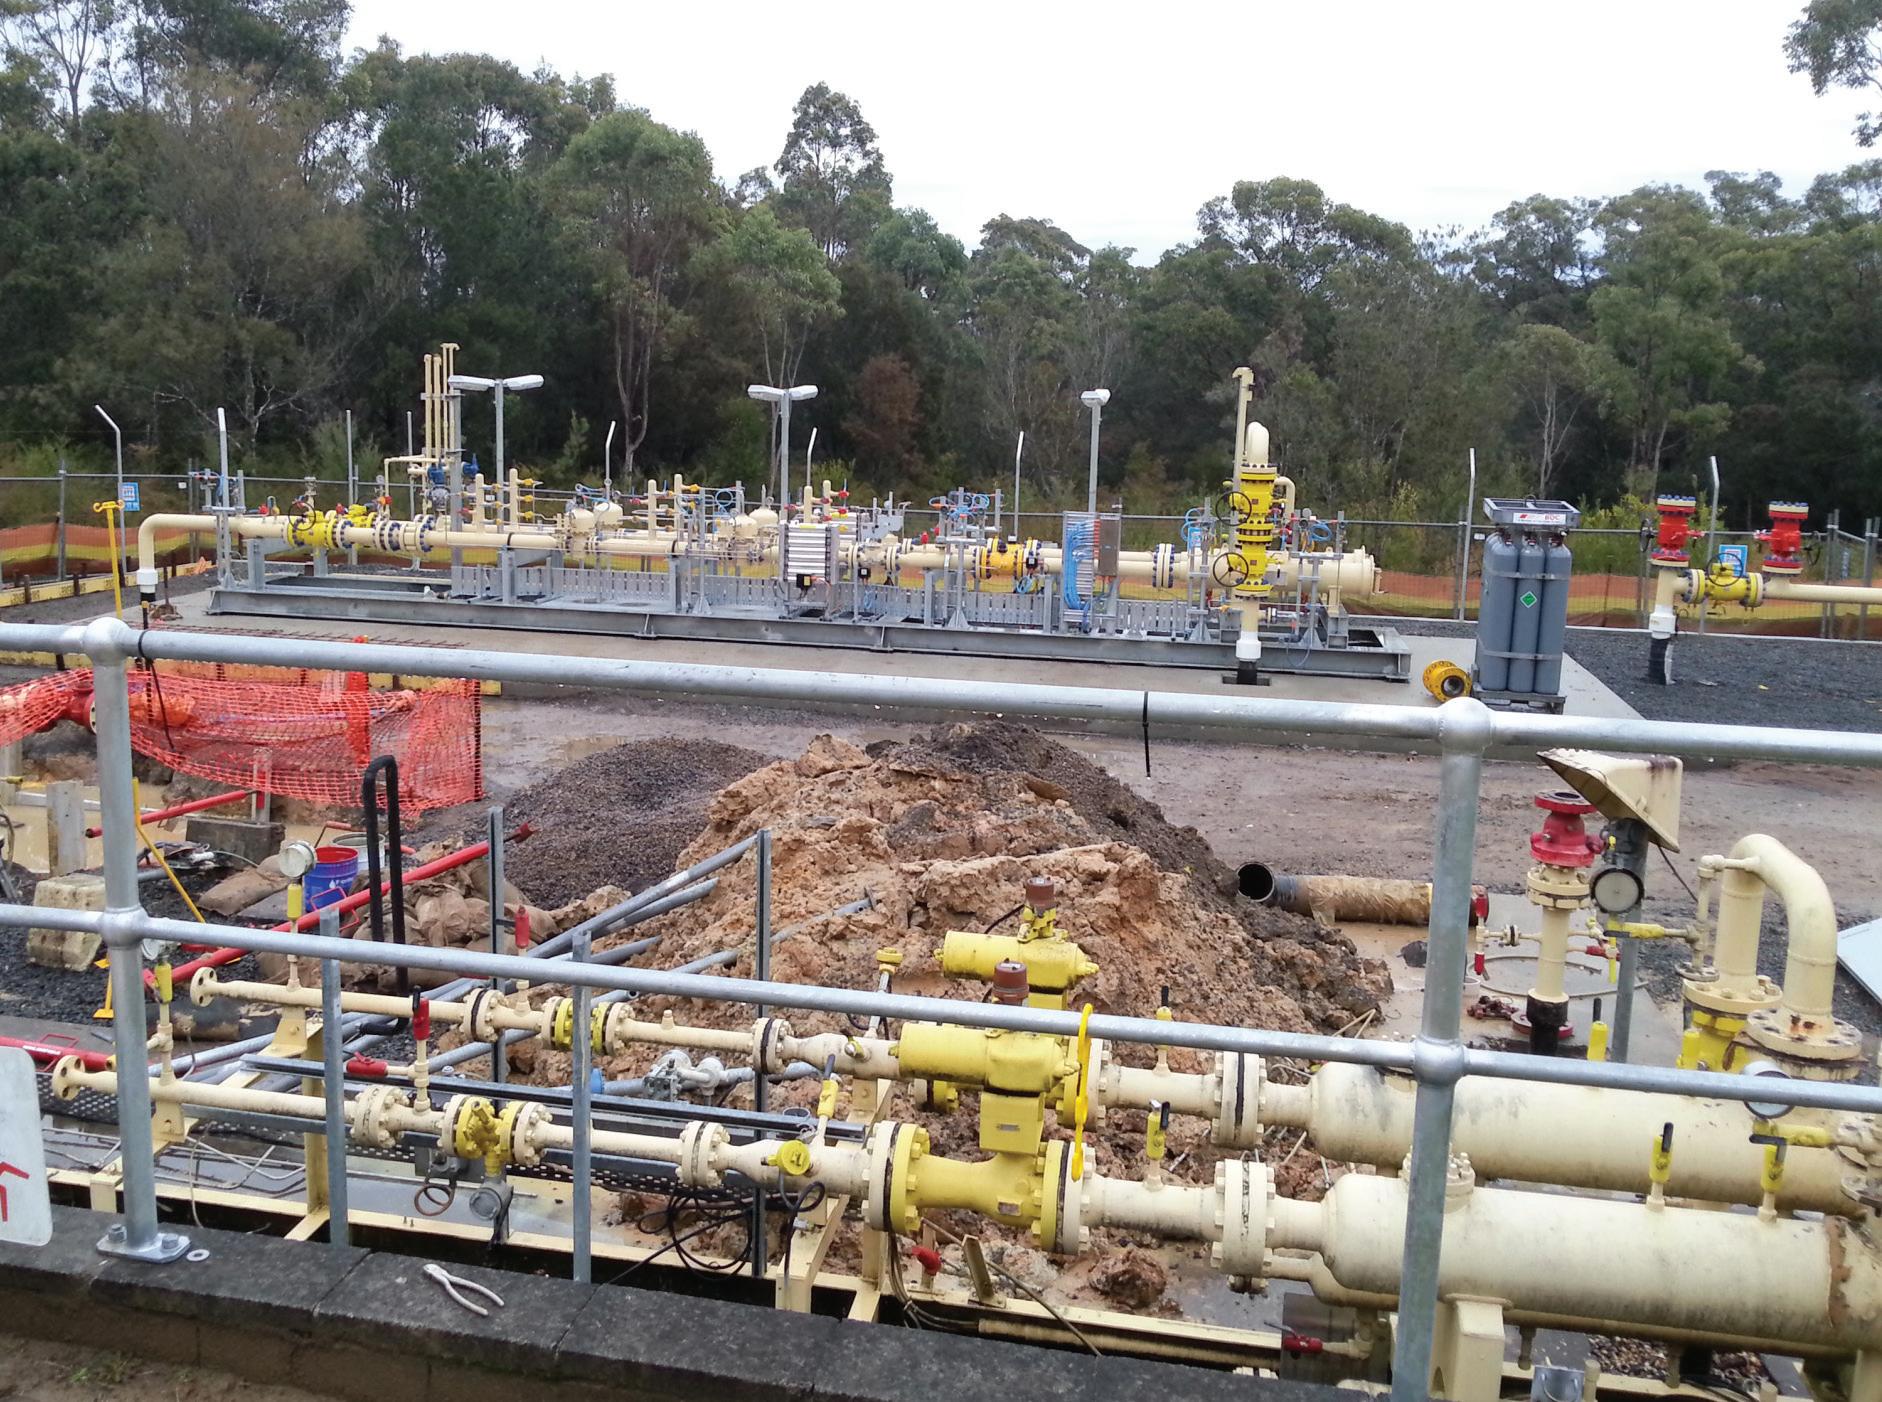
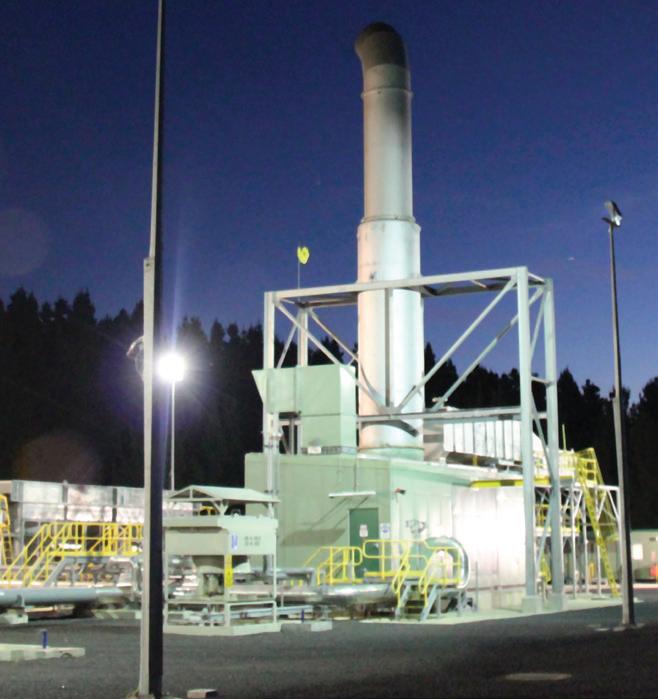
THE UPGRADE OF THE WYONG TRS IS JUST ONE OF MANY PROJECTS AIMED AT UPGRADING AND EXPANDING THE JEMENA GAS NETWORK WHICH DISTRIBUTES NATURAL GAS TO 1.1 MILLION CUSTOMER SITES THROUGHOUT NEW SOUTH WALES. THE SUPPLY OF NATURAL GAS TO MORE THAN 18,000 DOMESTIC, INDUSTRIAL AND COMMERCIAL CUSTOMERS IN THE WYONG AREA HAS BEEN IMPROVED AS THE RESULT OF JEMENA SUCCESSFULLY UPGRADING ITS WYONG TRUNK REGULATING STATION (TRS).
THE UPGRADE OF THE WYONG TRS - THE SINGLE SOURCE OF GAS FOR THE WYONG REGION – WILL ALSO CATER FOR FUTURE GROWTH IN DEMAND FOR NATURAL GAS. CURRENT PROJECTIONS PREDICT ANOTHER 36,000 HOMES WILL BE BUILT IN THE AREA IN THE NEXT 20 YEARS.
customers use electricity has changed significantly in the last few decades. Many customers are living in larger houses and are enjoying the use of high powered electric appliances such as big screen TVs and air-conditioners. In more recent times, quite a few customers have also been seeking out energy efficient appliances, while some have been connecting solar panels and taking advantage of once generous Government incentives. It has become a complex world for distribution businesses and customers alike.
In response to this increased complexity, Victorian network owners have invested in strengthening and smartening the network by increasing the size and amount of network equipment and installing new technologies such as smart meters. Network owners have also been faced with having to replace ageing network infrastructure to ensure
customers receive safe, efficient and reliable supply. This is because parts of the original network, much of which was built in the 1960s, had reached the end of their useful life. At the same time, the significant rise in the cost of capital after the global financial crisis also had a major impact on network charges. The above factors have all contributed to increased network charges in Victoria, though not to the scale seen in other states. In Victoria, distribution charges make up about 30% of a customer bill compared with approximately 50% in New South Wales and Queensland.
From a distribution business perspective, Jemena continues to concentrate on safely and efficiently completing the smart meter roll-out (due for completion in the first half of 2014) and improving our engagement with customers to ensure our service offering is tailored
WWW.UTILITYMAGAZINE.COM.AU UTILITY • FEBRUARY 2014 SECTION 17
FOCUS ON
Paul Adams, Jemena
Paul Adams, Jemena
... energy underpins almost everything we do in our homes and in our businesses. What we enjoy in our homes today such as cold milk from a fridge, hot water for a shower, meals cooked in minutes would have taken 50 slaves in the days of the Roman Empire to deliver.
to their needs. Leveraging the smart meter platform created in Victoria to benefit our customers will be an ongoing focus for our business.
There is no simple solution to the problem of rising electricity prices. However there are three things that consumers can do to reduce their impact.
First, customers can take up the opportunity of newly-available flexible time-of-use retail offers in Victoria and shift their consumption away from the more expensive peak period to off-peak periods wherever possible. Some customers who already minimise their consumption during peak periods will enjoy savings to their bill without having to change their consumption at all.
Second, if they can afford it, customers should buy energy-efficient appliances. For example, a new 7-star flat screen TV costs $980 a year less to run than a similar 1-star flat screen TV
Third, smart meters combined

with web portals such as Jemena’s Electricity Outlook can help customers better understand and better manage their electricity consumption. Armed with this information, customers can choose a retail offer that works best for them. The Essential Services Commission estimates one in five households is on default tariffs, known as standing offers. Market offers are generally cheaper than default rates.
Tell me a bit about the path that led you to be MD of Jemena
During my 30-year career, I have had the privilege of working in all facets of the gas and electricity supply chain –from generation to retailing and from exploration to storage. I have also held roles in both the technical and commercial disciplines
You’ve had experience in both the technical and commercial sides of utilities. Do you think this combined
perspective is important for your role now?
Definitely. You can only lead a business if you understand the issues and if you can talk the talk to all with whom you work. Put another way, as an MD you have to be able to “talk turkey” with all people inside and outside the business.
How has the energy utility sector changed during your time in it? Have any changes surprised you?
The industry has gone from being vertically-integrated from production to retailing to being horizontally-integrated where companies and people specialise in certain parts of the supply chain. There has also been a change in focus from being state-based to being able to ship and deliver energy across state boundaries. The changes haven’t really surprised me because the foundations – pipelines in gas and poles and wires in electricity are still in place.
What will energy utilities look like 30
UTILITY • FEBRUARY 2014 WWW.UTILITYMAGAZINE.COM.AU 18
FOCUS ON
years from now?
We have gone from a really basic internet with a green screen to having high-speed applications on your phone, in other words at your fingertips. All of these applications still have basic foundations – these are still underpinned and supported by cables. The electricity grid will therefore be a bit like an electricity internet.
The foundations – poles and wires for electricity and pipelines for gas –will still be in place but the merger of digital communication and energy delivery from a technological and environmental perspective will be a feature of the future. In 30 years, electricity networks, for example, will be used in different ways to support everything from solar panels to electric vehicles.
What do you love about energy utilities?
I love them because the safe, efficient and reliable supply of energy underpins almost everything we do in our homes and in our businesses. What we enjoy in our homes today such as cold milk from a fridge, hot water for a shower, meals cooked in minutes would have taken 50 slaves in the days of the Roman Empire to deliver. As an industry, we have sought to continuously adapt to changing customer needs by efficiently delivering safe and reliable energy.
What are you most proud of from your time in the sector?
I am proud of the fact that when there are bushfires and floods, we step up to the plate by pulling out all stops to get customers back on supply as safely and as quickly as possible. In cases like this, I find Jemena employees always go that extra distance in order to do the right thing by customers in their time of need.
All this is done by people who have no egos. They just go out and get the job done. Often it is only at times like
this that the value they add to the community is realised.
What does a typical day involve for you?
There is no such thing as a typical day in this industry, or even a typical week. When I look back over the past week for example, my activities include flying from Melbourne to Canberra and back, flying from Melbourne to Sydney and back, one conference call with someone in Singapore and another conference call with someone in China, a conversation about safety with one of our guys in the field, two board meetings as well as several internal meetings including performance reviews and a discussion with a major customer.
What is the main thing that people outside of this industry don’t understand, that people inside do?
So often those outside the industry take for granted the effort involved to deliver safe, efficient and reliable energy. Efficient supply of safe and reliable energy requires the working
Paul Adams, Jemena
together of thousands of bits and pieces in a network. People only realise the value of reliable supply when it is taken away from them. The true value to customers is actually more than just energy delivery. To use electricity as an example, without the platform of the grid, customers would not be able to enjoy the benefit of solar panels or voltage stability.
What can energy utilities do better than they are doing at the moment?
In addition to continuously improving our focus on customers, and to use electricity as an example, we have to be conscious that when it comes to installing solar panels or air-conditioners, there are winners and losers.
For example, not all homes have solar panels but the cost imposed on the networks by enabling electricity to be taken back from the home to the grid, is a cost that is spread across all customers. So those who don’t have solar panels are effectively subsidising those who do.
Similarly, not all homes have air-conditioners. However, according to
WWW.UTILITYMAGAZINE.COM.AU UTILITY • FEBRUARY 2014 SECTION 19
FOCUS ON
Paul Adams, Jemena
Productivity Commission figures, each 2kW air conditioning systems requires around $7,000 of added infrastructure investment – made up of $4,000 in distribution (in neighbourhoods), $1,400 in transmission (from the central coal-fired power station), and $1,600 in generation costs (gas- fired peakers).
Again, such costs are spread among all customers, so those without air-conditioners are effectively subsidising those with air-conditioners. As an industry, we need to do whatever we can to make sure those who are losers do not suffer any economic hardship by pricing and costing accordingly.
Do you think the role of engineers is undervalued in society today? How can that be improved?
Yes, I do. Every successful society sees inherent value in engineers. When it’s all going well, engineers are not as valued as the arts and finance professions. However, when things don’t go well in our world, more often than not we turn to engineers to find solutions to problems – and engineers are asked to step up to the plate. The value of engineers is well documented in our history – for example roads built by engineers in the time of the Roman Empire survive to this day.
Do you think the services provided by utilities can be taken for granted? Is this a bad thing, or should it be a goal for utilities?
Yes, but I don’t think it is a bad thing. Sometimes I wonder if energy is properly valued. According to the Australian Bureau of Statistics, in 2012, energy costs represented around 5% of the average gross weekly household income. The average Australian household spent $39 per week on electricity and gas for their homes.
The fact is a lot of our daily activities, which we take for granted, should be quietly appreciated. Every morning
I can get cold milk out of my fridge instead of having to personally milk a cow. I can also have a hot shower and enjoy a cooked breakfast – both without having to build a fire. These are simple pleasures of modern day life that are underpinned by energy which we take for granted. For thousands of years, however, not even kings enjoyed the things we enjoy every day – such as safe, reliable and efficient energy supply - and which we often take for granted.
Is the utility sector attracting enough young people and are there good career paths available?
Yes. When I look around Jemena I see we have attracted good, first-class and highly-skilled young people. There are good career paths in the industry because it is one that continues to grow and it is one where the core of it can’t be exported offshore.
What advice would you give someone setting out on a career in the utility sector now?
I would say to any person: Get involved and give it a go rather than sitting and waiting for something to happen or expecting to be taken care of. This is a ‘doing’ industry and it is people who make things happen. So if you want to get ahead you should take every opportunity you can to make things happen.
What is the greatest challenge facing Jemena at the moment?
Helping our customers, whose businesses are sensitive to gas price rise, through the transition from current prices to potentially higher prices.
What could other utilities learn from Jemena?
Are there lessons Jemena could learn from other utilities – what are some of the others doing well?
We are all involved in industry bodies and we all have a learning culture. This means we share and exchange
Worldwide, we are all seeing the trend where we are seeking to find a balance between energy affordability and environmental sustainability. This is a challenge for all of us in the utilities industry.
ideas because we are continuously striving for a better outcome for our customers
What overseas trends should we expect to see in Australia in future? What can international utilities learn from Australia?
Our regulatory frameworks in Australia are fairly robust and many overseas countries are looking to adopt our frameworks.
In Victoria, our rollout of smart meters is one of the largest of its kind and a lot of countries are watching this rollout very closely.
Worldwide, we are all seeing the trend where we are seeking to find a balance between energy affordability and environmental sustainability. This is a worldwide challenge for all of us in the utilities industry.
And finally introducing new technologies, distributed renewables and using technology to reduce cost, improve reliability and reduce environmental footprint in a coordinated, efficient manner.
UTILITY • FEBRUARY 2014 WWW.UTILITYMAGAZINE.COM.AU 20
FOCUS ON
MELBOURNE WATER’S CAPITAL WORKS PROVIDERS ANNOUNCED
Melbourne Water has selected the joint venture between KBR and John Holland (JHKBRJV) to deliver engineering, procurement and construction services for water, wastewater and drainage projects in Melbourne over the next three years. JHKBRJV is one of two joint ventures that will deliver these services as part of Melbourne Water’s 2013 Water Plan capital works program.
The JHKBRJV partners bring a wealth of experience and expertise to the capital works program and welcome the opportunity to work with Melbourne Water in their focus to deliver water infrastructure improvements for the people of Melbourne.
KBR’s Director of Water, Asia Pacific, Ted Cusack, said the joint venture partners are looking forward to working collaboratively with Melbourne Water on delivering successful projects under this innovative new water infrastructure delivery model.
KBR and John Holland have collectively delivered over $8 billion worth of water infrastructure projects.
MAJOR WATER UPGRADES ANNOUNCED FOR MELBOURNE’S SOUTH EAST
Victorian water and sewerage retailer
South East Water has appointed two design and construction consortia to undertake approximately $400 million of water and sewerage works in Melbourne’s South East, as part of its five year capital works program.
Contracts were signed in late 2013 by two joint ventures: Fulton Hogan, Delplant and Beca, and Comdain Infrastructure, Downer EDI and MWH. The two teams have secured a place as South East Water’s capital delivery partners for major pipes and structures work.
NEW WSAA CHAIR APPOINTED
South East Water General Manager Asset Creation Charlie Littlefair said the program of works will start this month and continue through until June 2018, in line with the company’s five year Water Plan.
“The program will deliver approximately $400 million in capital works, with a focus on designing and constructing trunk sewer mains, water distribution mains, recycled water mains, water and sewage pump stations, reservoirs and contingency tanks and minor sewer treatment plant upgrades,” said Mr Littlefair.
The Water Services Association of Australia (WSAA) has appointed ACTEW Water Managing Director Mark Sullivan as its new Chair.
ACTEW hopes the appointment will give the ACT a valuable opportunity to guide and influence water policy decisions of national significance.
Mark Sullivan will take over from outgoing Chair, Sue Murphy who is also Chief Executive of the Water Corporation of Western Australia. Ms Murphy has spent two successful years leading the organisation.
Michael Easson, Chair of ACTEW was pleased to congratulate Mark Sullivan on this new role which will allow him to make a significant contribution to the water industry across Australia.
DIGITAL WATER METER TRIAL IN MELBOURNE’S SOUTH EAST
A thousand South East Water customers are set to trial the next generation of digital water meters.
Residents in Seaford and South Yarra are some of the first water customers to trial the new meters as a part of South East Water’s investigations into how improved technology can help reduce the volume of water lost through leaks and create a more intelligent water network for the future.
South East Water Managing Director Kevin Hutchings said initial testing of the technology has already indicated significant water savings can be achieved, with the potential for savings to flow on to the customer.
“Early testing in Belgrave South indicated significant water savings can be achieved for customers – with 12 per cent of the water supplied at the test site lost through leaks. For one customer alone this meant a reduction of up to 50 per cent of their water and sewerage bill,” said Mr Hutchings.
“These new meters read the volume of water that enters a property every 30 minutes. We can then identify irregular water use at a customer’s property, which may be caused by a water leak.”
NEW SYDNEY WATER CHAIRMAN APPOINTED
The NSW Government has appointed Mr Bruce Morgan as Sydney Water’s new Chairman until September 2016. Mr Morgan takes over from Dr Tom Parry, who was Sydney Water’s Chairman from August 2007 to September 2013.
Mr Morgan has been on Sydney Water’s Board as a Director since January 2012 and has been acting Chairman since Dr Parry’s term ended in September.
Mr Morgan was previously a partner with the leading global firm PricewaterhouseCoopers (PwC) for more than 25 years. He served as Chairman of the Australian PwC Board and on the PwC International Board.
Mr Morgan is a director of Caltex Australia Limited, Origin Energy Limited, the University of NSW Foundation, the European Australian Business Council and of Redkite.
21 WWW.UTILITYMAGAZINE.COM.AU UTILITY • FEBRUARY 2014 SECTION SECTION NEWS water/sewer
$4 MILLION UNDERGROUND POWERLINE PROJECT UNDERWAY
A $4 million project by Ergon Energy to install underground powerlines in parts of the CBD of Ingham, Qld has begun.
The project aims to significantly improve electricity supply during the storm and cyclone season.
Ergon General Manager Service Delivery Northern Paul Ryan said the project is part Ergon Energy’s Cyclone Area Reliability Enhancement (CARE) program where critical powerlines supplying key community infrastructure are being undergrounded to reduce the risk of severe storm and cyclone damage.
“Approximately 15 km of powerlines are being undergrounded in Lannercost, Herbert and Anne Streets to supply power to Hinchinbrook Shire Council Hall, two supermarkets, a fast food outlet and the local cane growers association offices.
“These businesses provide essential and important services to the community especially in times of severe storms or cyclones which could cause network damage and widespread power interruptions. They help the community to access goods and services which is dependent upon power and start the process of returning
to normality after severe weather events,” Mr Ryan said.
The existing overhead network supplying these businesses will remain in place.
Queensland Energy Minister Mark McArdle congratulated Ergon on the project saying the works were an important step in ensuring reliable electricity supply.
“While severe weather may still affect power, CARE improvements although not cyclone proofing, are designed to allow faster restoration of power to key community facilities and to some extent mitigate the impacts of cyclones or severe storms upon communities,” Mr McArdle said.
The project is expected to be finished in January 2014 and is a continuation of other CARE projects undertaken at Ingham.
They include the Ingham Hospital, Ingham Primary and High Schools, and aged care facilities – Palms Nursing Homes and Blue Care’s Ingham Blue Haven Lodge.
CARE projects to protect selected high voltage powerlines have been undertaken in high risk cyclone-prone communities from Mackay north to Cairns since 2001.
SP AUSNET CHOOSES SMART METER COMMUNICATIONS SOLUTION
SP AusNet has selected Ericsson to develop and implement a 3G network-enabled communications solution to support its electricity smart meter program.
The company intends to extend its existing smart meter footprint with an Ericsson solution that uses public 3G mobile networks and will reach a further 108,000 meters in outer urban and rural areas.
SP AusNet’s Director of Market Services Simon Hastings says: “Our partnership with Ericsson to develop a 3G solution provides a cost-effective means for customers in low-density, regional areas to access the benefits of smart meters.
Head of Ericsson Australia and New Zealand Håkan Eriksson says: “This Australian smart grid solution is a first in combining an existing 3G network, a 3G-enabled smart meter module, a purpose-built meter management system and the systems integration required to pull it all together.
“The utilization of secure public wireless networks to support smart grids is significant as it allows utilities to focus on delivering energy to homes and businesses by minimizing the task of managing a complex communications network.”
UNDERGROUND POWER LINES TO REDUCE BUSHFIRE RISK IN VIC
The targeted replacement of powerlines in high-risk bushfire areas is underway in Victoria as part of a $750 million state government funded program to reduce the risk of bushfires started by electricity assets.
Victorian Minister for Energy and Resources Nicholas Kotsiras said work had begun in the state’s highest-priority bushfire areas under the Powerline Replacement Fund, which will see the Government spend up to $200 million over 10 years to replace bare-wire overhead powerlines.
“The replacement of overhead lines in high risk areas is a crucial part of our $750 million program to make Victorians safer from bushfires started by powerlines,” Mr Kotsiras said.
“Today saw the first of many overhead powerlines in high risk areas being replaced with underground cabling and we will also be replacing powerlines with insulated cable and aerial bundled cable, all of which reduce the risk of wires clashing and starting fires.”
Mr Kotsiras said the Government had already carried out major infrastructure upgrades and made improvements to how Victoria’s electricity network was managed, under its 10-year program, which fully implements the recommendations of the Victorian Bushfire Royal Commission.
“The extensive work already carried out is making Victorians safer” Mr Kotsiras said.
The Fire Services Commissioner has identified areas in and around the Dandenong Ranges, the Otway Ranges and Warburton District as target areas for the first phase of powerline replacement. Both privately owned overhead electric lines and high voltage powerlines owned by distribution companies will be replaced in targeted areas under the program. Once phase one is complete there will be further works across the state in areas of high risk.
UTILITY • FEBRUARY 2014 WWW.UTILITYMAGAZINE.COM.AU 22
NEWS
electricity
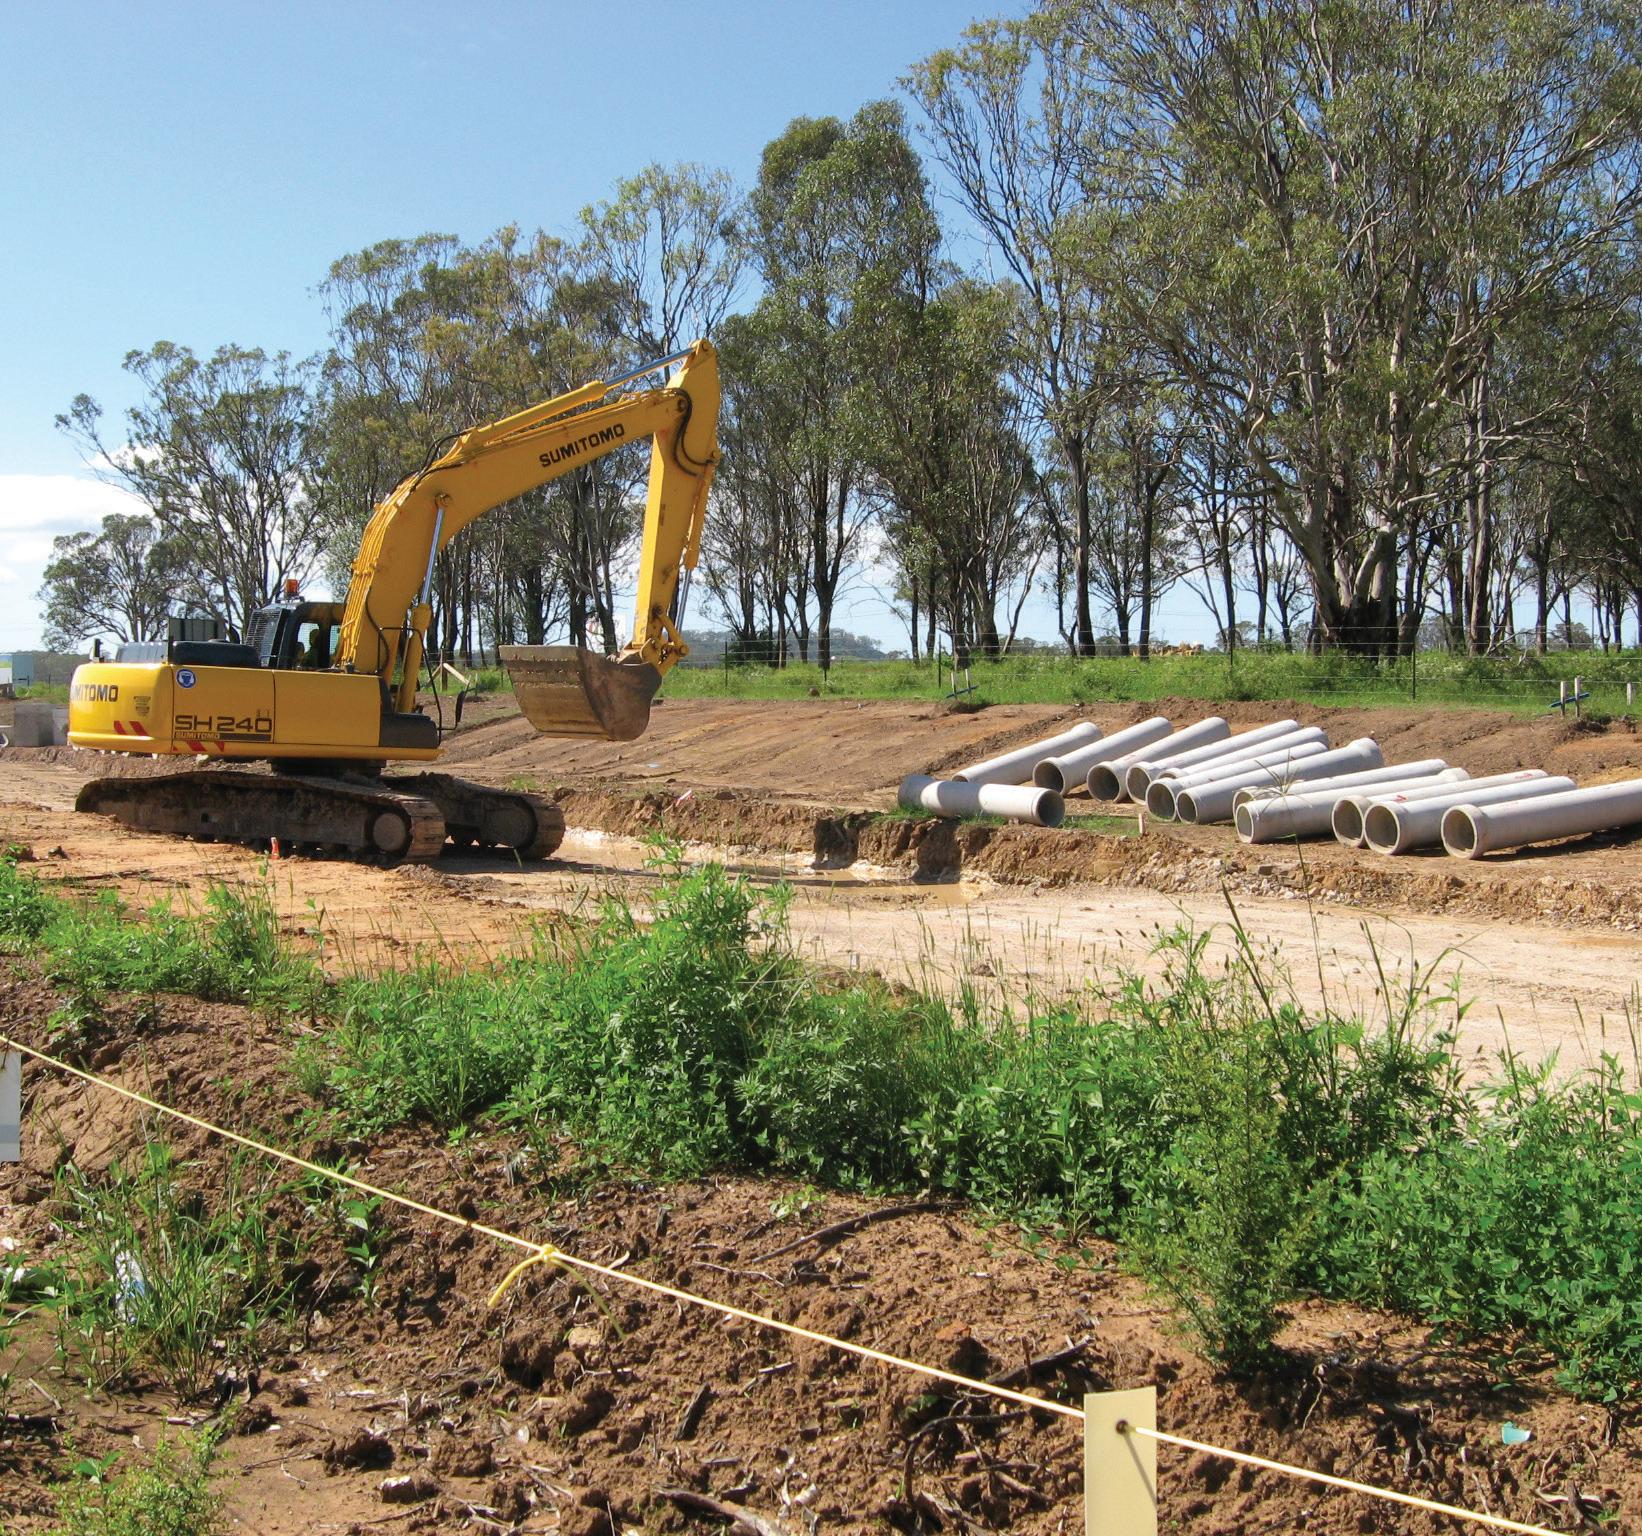
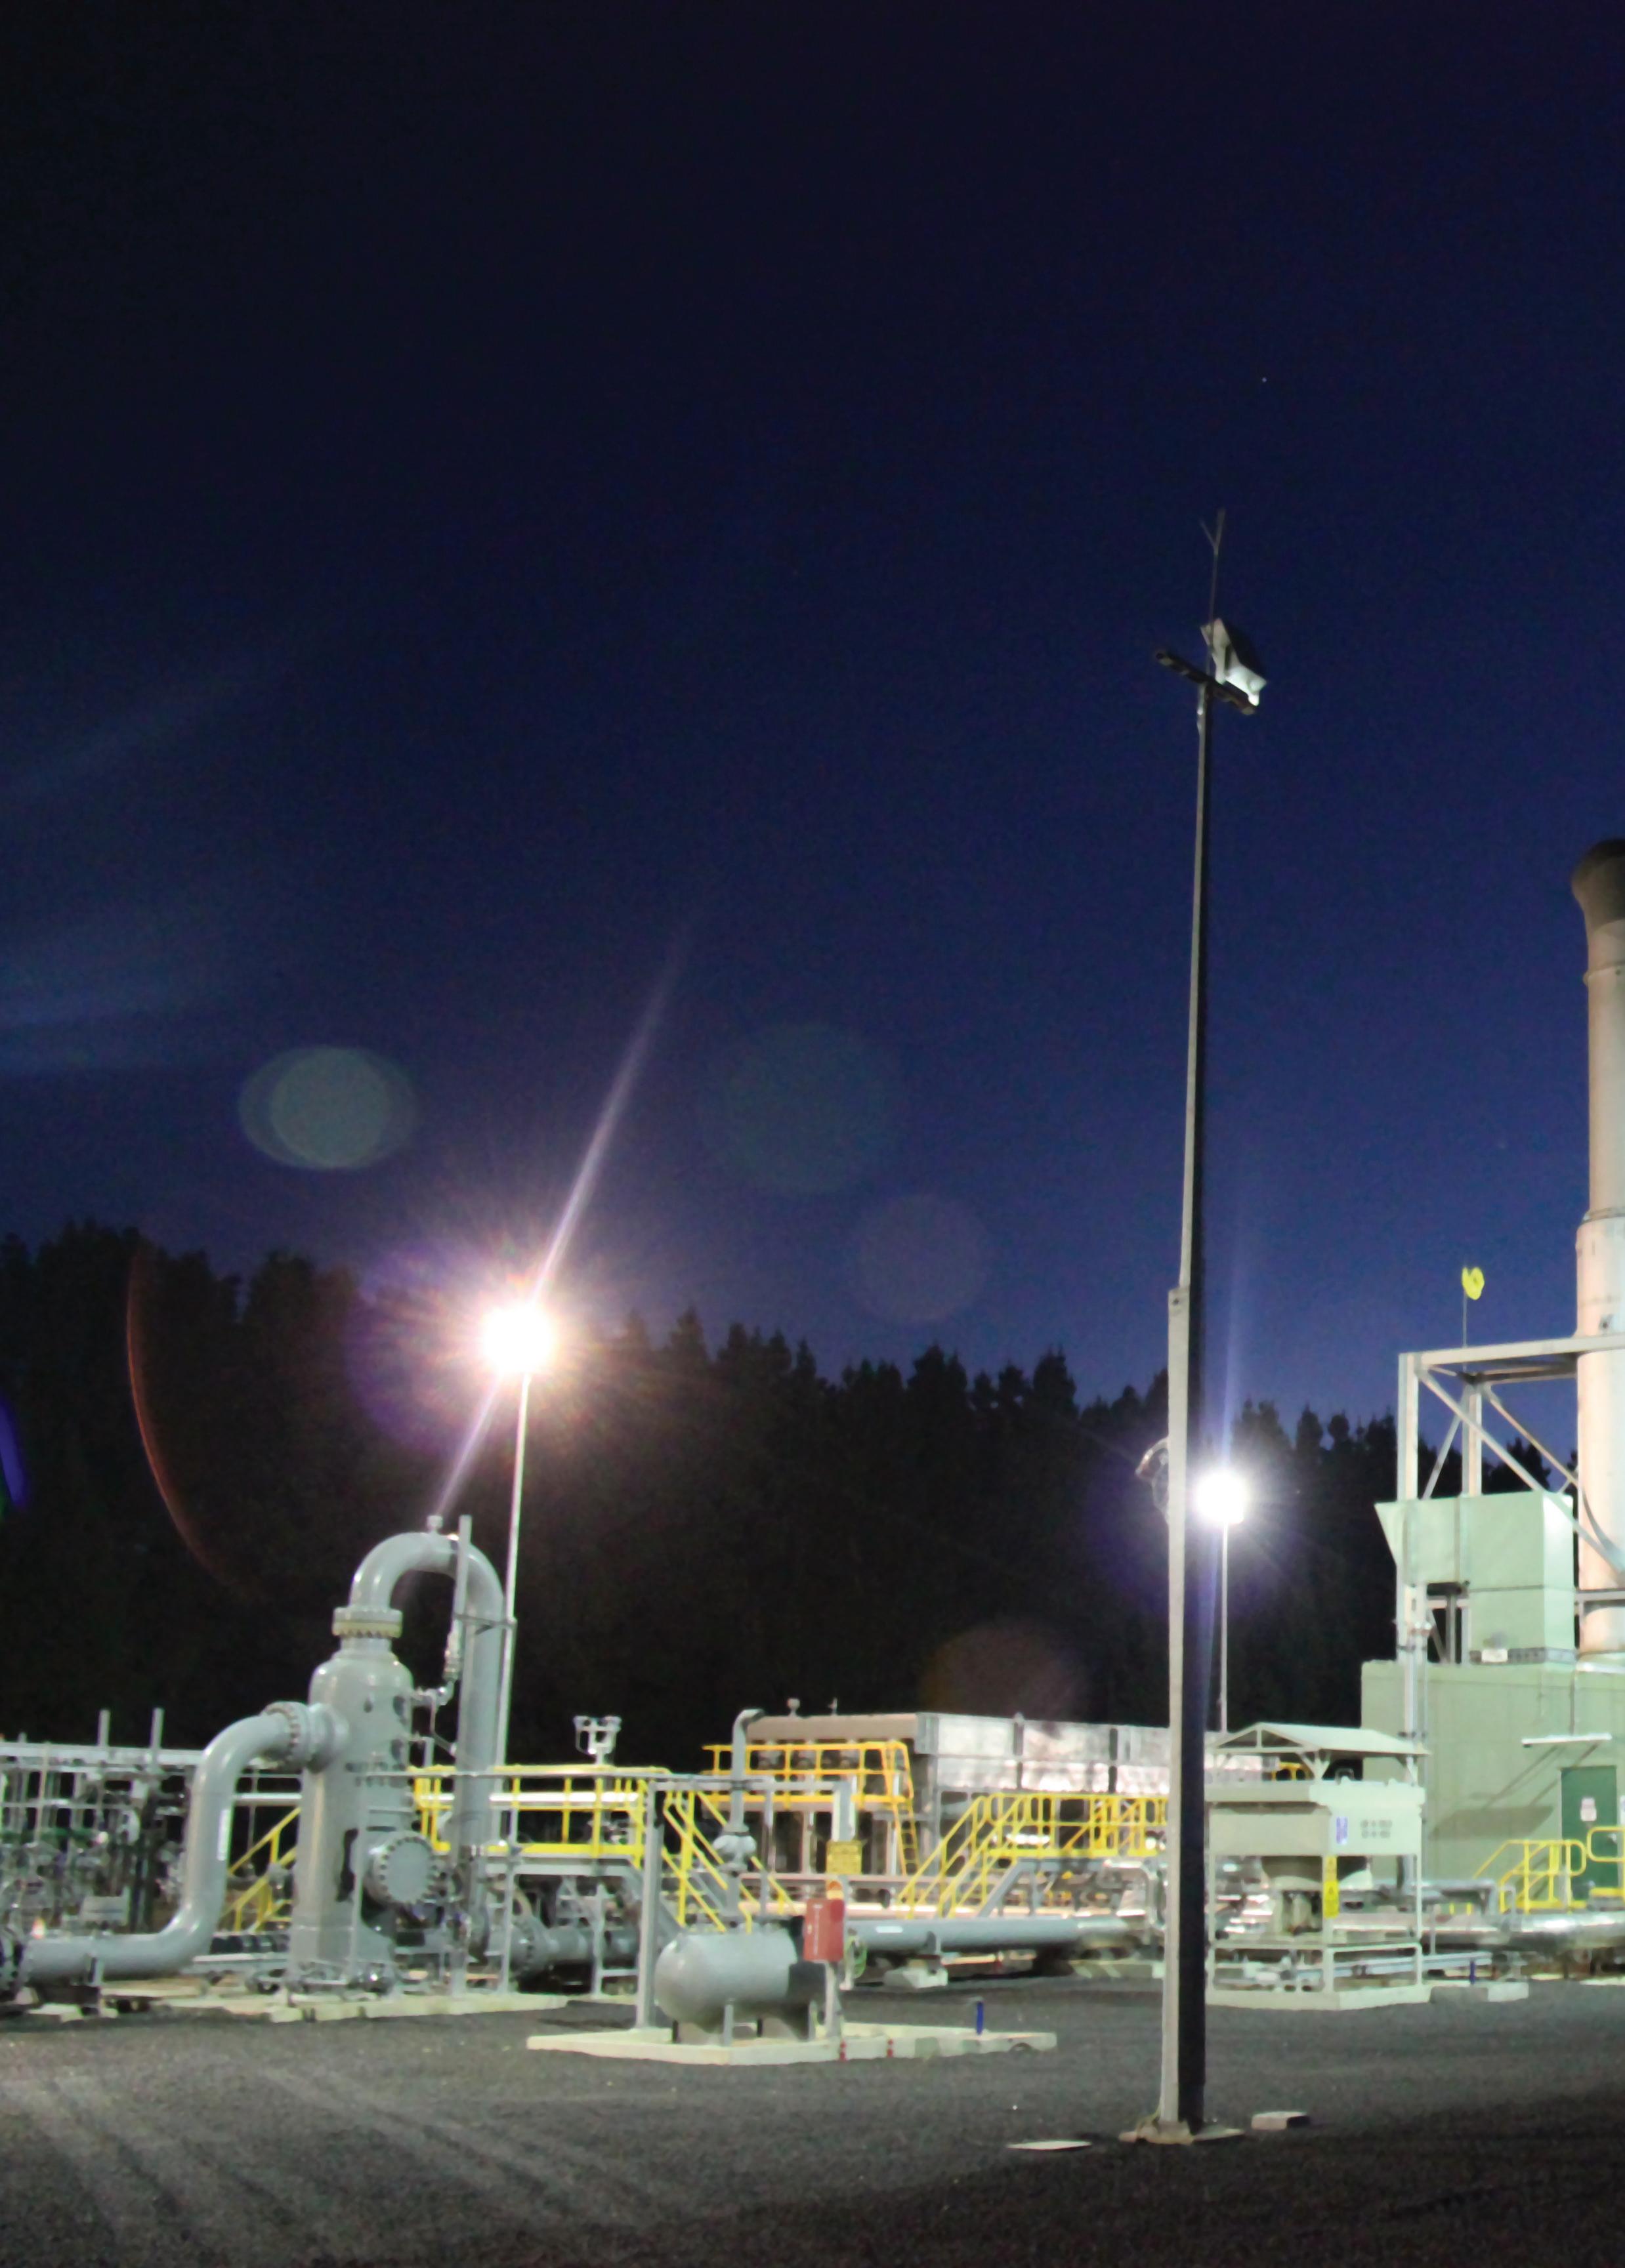
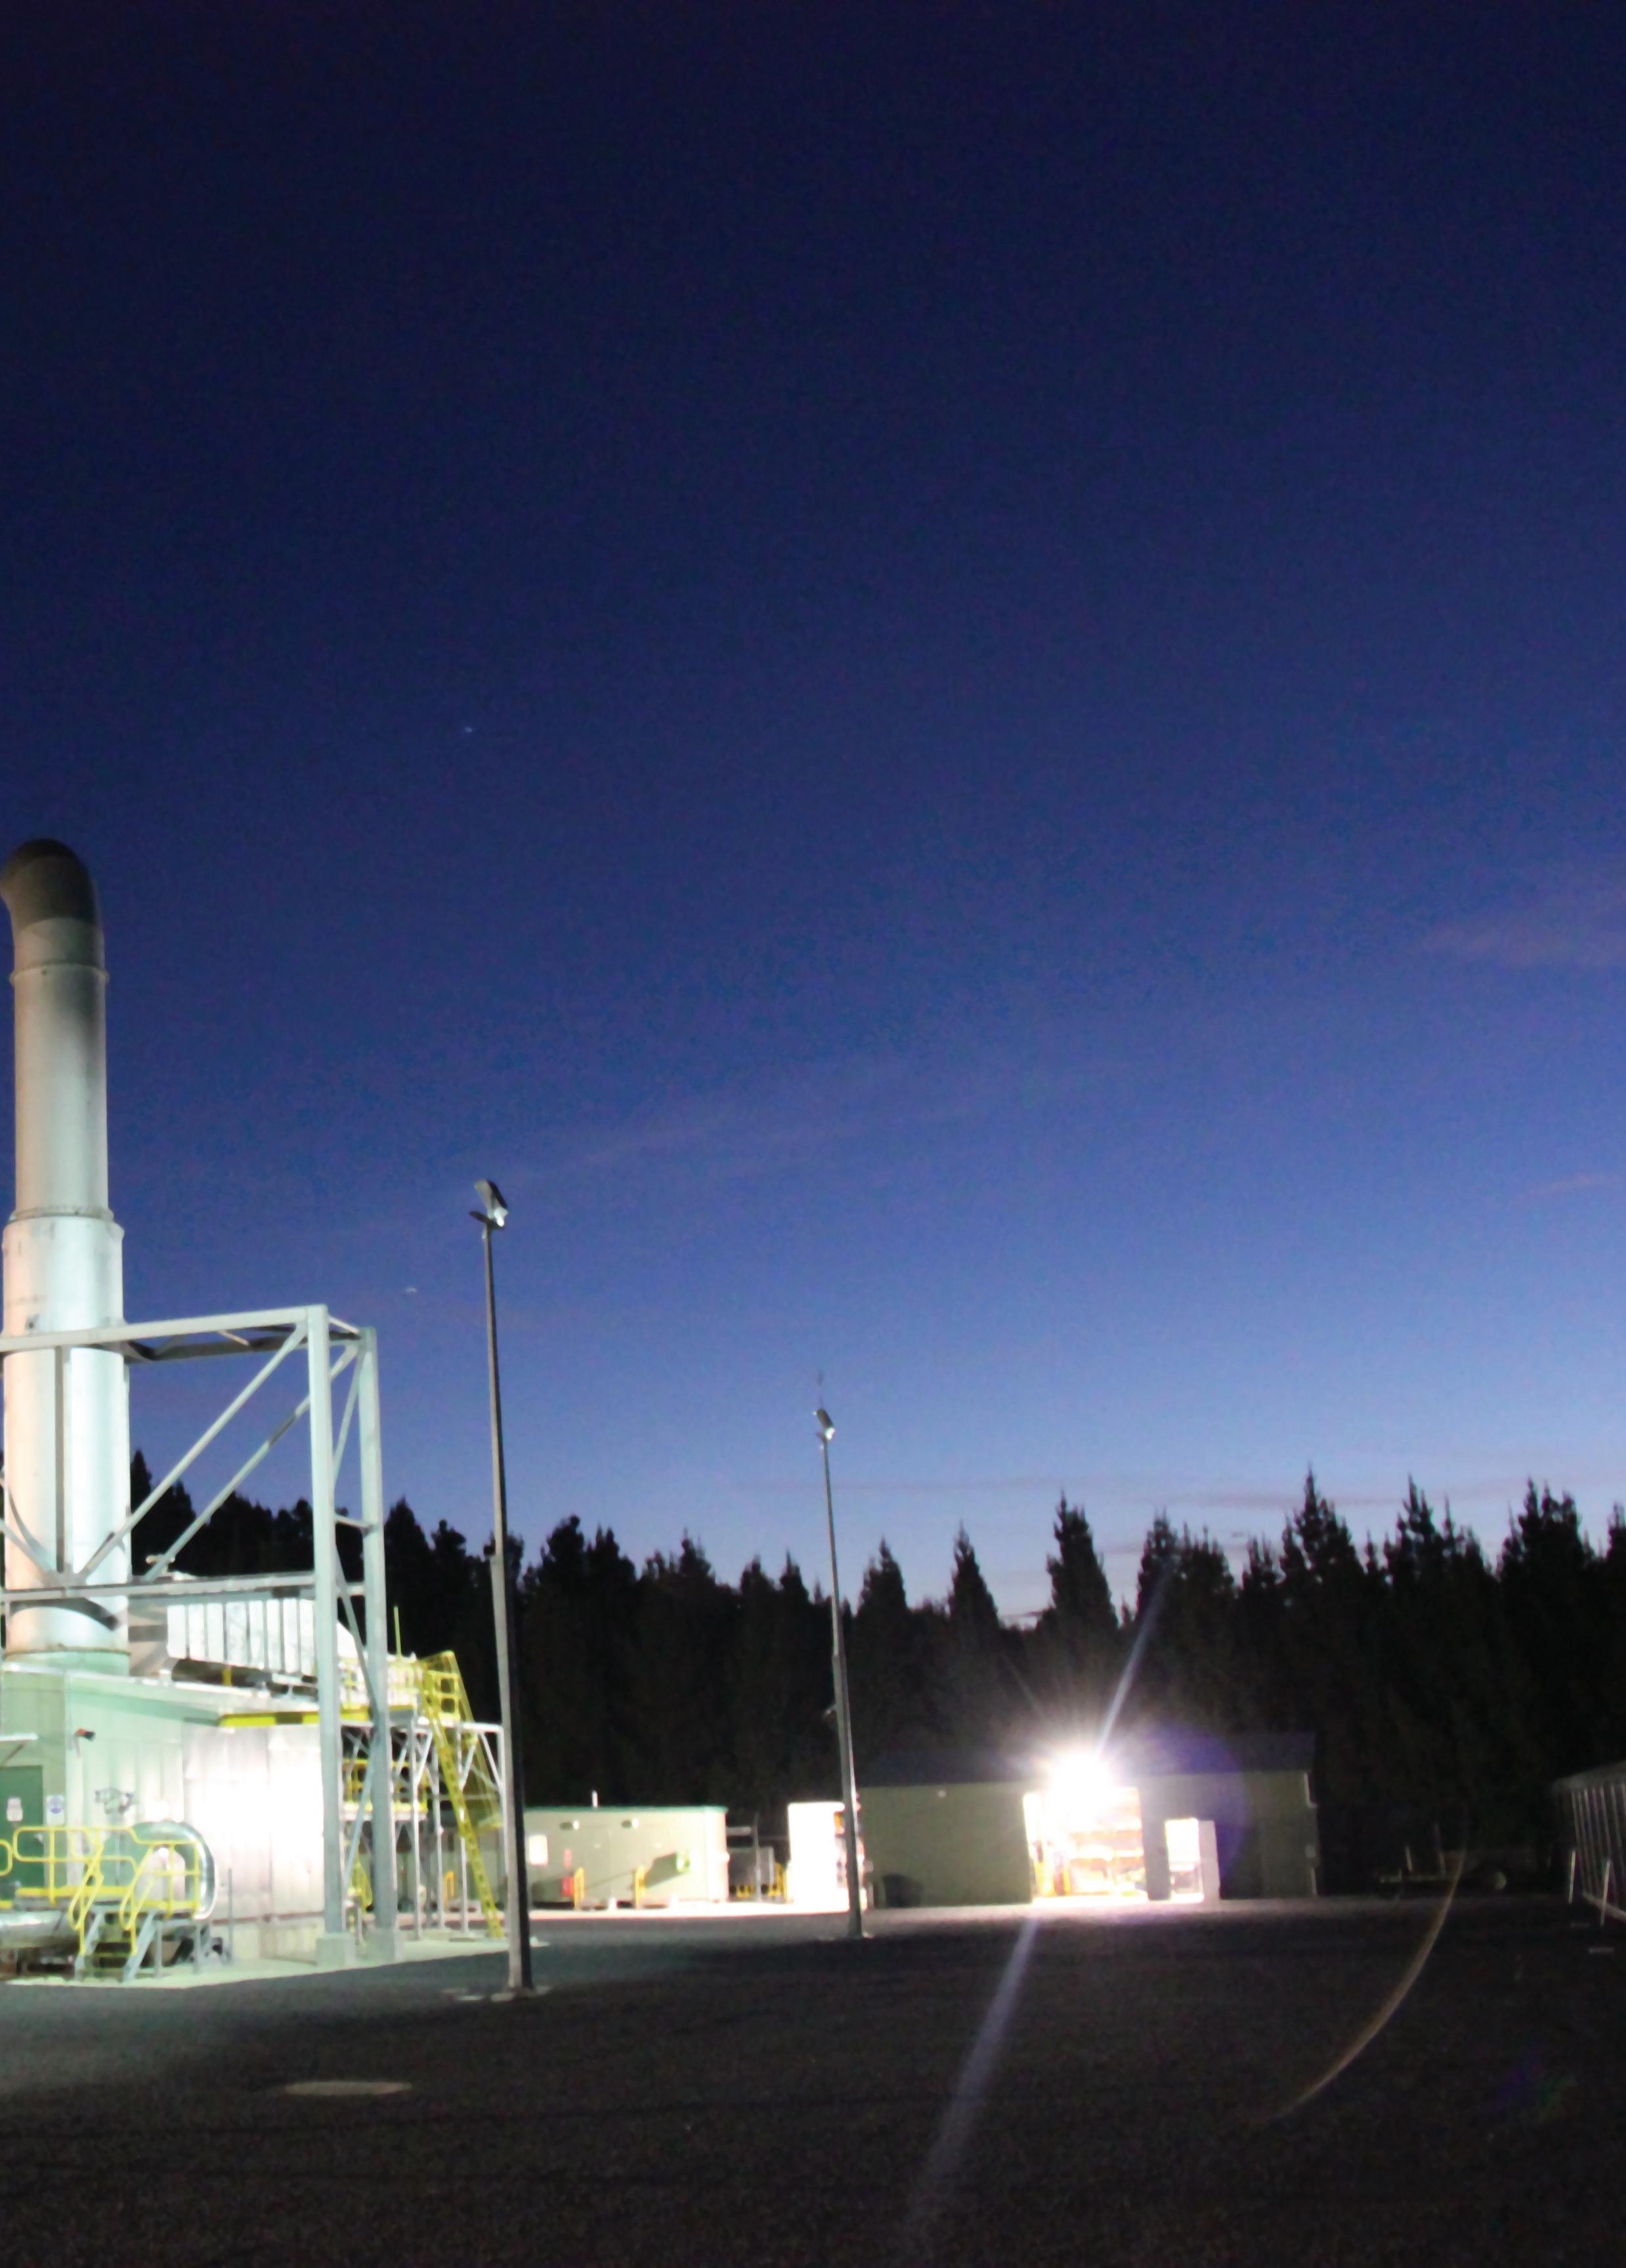
CONSTRUCTION BEGINS ON LONGFORD GAS CONDITIONING PLANT
Esso Australia has announced the start of construction on the new Longford Gas Conditioning Plant at a ground breaking event with The Hon Peter Ryan MLA, Deputy Premier of Victoria and Scott Rossetti, Mayor of Wellington Shire Council. The plant will process gas from the Kipper Tuna Turrum Project, Australia’s largest domestic gas development located on the eastern seaboard.
“The Gas Conditioning Plant project is part of Esso and BHP Billiton’s significant investment program in natural gas projects in Gippsland,” said Richard Owen, Chairman of ExxonMobil Australia. “Once the plant is operational in 2016, we will deliver 1.6 trillion cubic feet of gas to the East Australia market, helping replace declining production from existing fields.”
The Gas Conditioning Plant is a major
project for Gippsland and is expected to create around 250 direct construction jobs as well as other indirect employment opportunities.
“Our plans for Longford make this an exciting time for Gippsland and Victoria,” Owen said. “The construction of the plant requires the effort of many hundreds of people working closely together to ensure the project is developed in a safe and environmentally responsible manner.”
CB&I Constructors Pty Ltd have been awarded the engineering, procurement and construction contract for the plant and will manage the construction site.
The Gas Conditioning Plant is being built adjacent to Esso’s existing Longford facilities near Sale. Initial activity at the site will include the establishment of basic infrastructure including
administration buildings, training facilities, roads and parking to accommodate the construction workforce. Warehousing and laydown areas adjacent to the new plant will also be established to temporarily store materials and equipment prior to being installed.
Esso Australia’s facilities at Longford have been operating for more than 40 years but were designed to treat natural gas with a different composition. The new plant is needed to condition Kipper Tuna Turrum natural gas to meet gas quality specifications for sale into the market.
The plant is being developed by Esso Australia as part of the Gippsland Basin Joint Venture in which Esso Australia Resources Pty Ltd (EARPL) and BHP Billiton Petroleum (Bass Strait) Pty Ltd each have a 50 percent interest.


WWW.UTILITYMAGAZINE.COM.AU UTILITY • FEBRUARY 2014
23 Q L D , N Z , N T & P N G Rod Wellings Phone: 0428 571 234 V I C Arthur Kokolekos Phone: 0439 337 247 N S W & ACT Tim Curtis Phone: 0408 079 073 TA S ( T E MTR O L ) Cameron Stevenson Phone: 0407 342 113 W A ( H I NC O ) John French Phone: 08 9455 6777 S A ( AC T I V E ) David Elliot Phone: 08 8177 0111 mini Analysers Monitor process, reduce energy and chemical costs, meet limits Accurate, Reliable AND Affordable! MODELS mini oP Orthophosphate mini LowAm Ammonia mini UV254 % Transmittance mini Mn Manganese mini LowChlor Chlorine W EB www.roycewater.com.au E M A I L contact@roycewater.com.au ChemScan ® NEWS Gas Sign up for our e-news at www.utilitymagazine.com.au

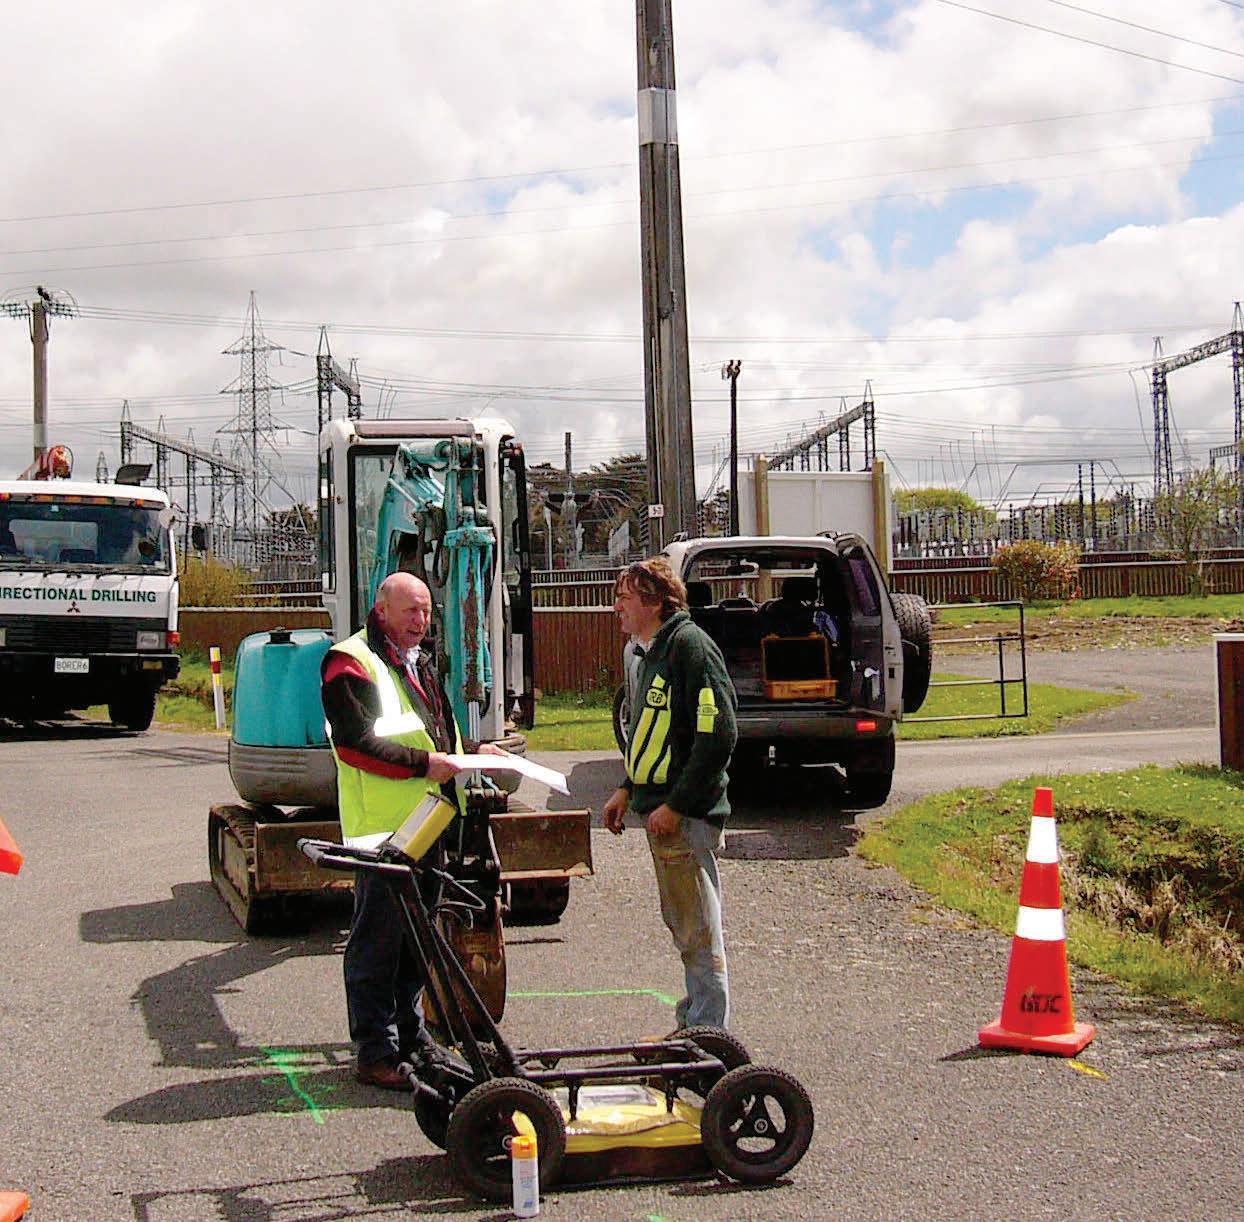
AFTER YOU DIAL, BUT BEFORE YOU DIG
When carrying out any excavation calling Dial Before You Dig (DBYD) is only the first step. To avoid costly and dangerous damage you must still get a more definite picture of exactly where buried services lie. A range of tools and techniques are available to help locate underground utilities.
24 UTILITY • FEBRUARY 2014 WWW.UTILITYMAGAZINE.COM.AU
UTILITY LOCATION
ADBYD map is a vital starting point, but once you are on-site the actual services rarely follow exact the path indicated in installation plans. Common utility services such as electricity, gas, water and communications cable are usually buried at a depth of 200 – 600mm beneath the surface. Striking even domestic power or gas supplies is a serious health and safety issue that can result in serious injury or even death. Damage to other services can cause disruption leading to compensa-
tion claims that run into many thousands of dollars.
There are three main methods of locating and avoiding buried services:
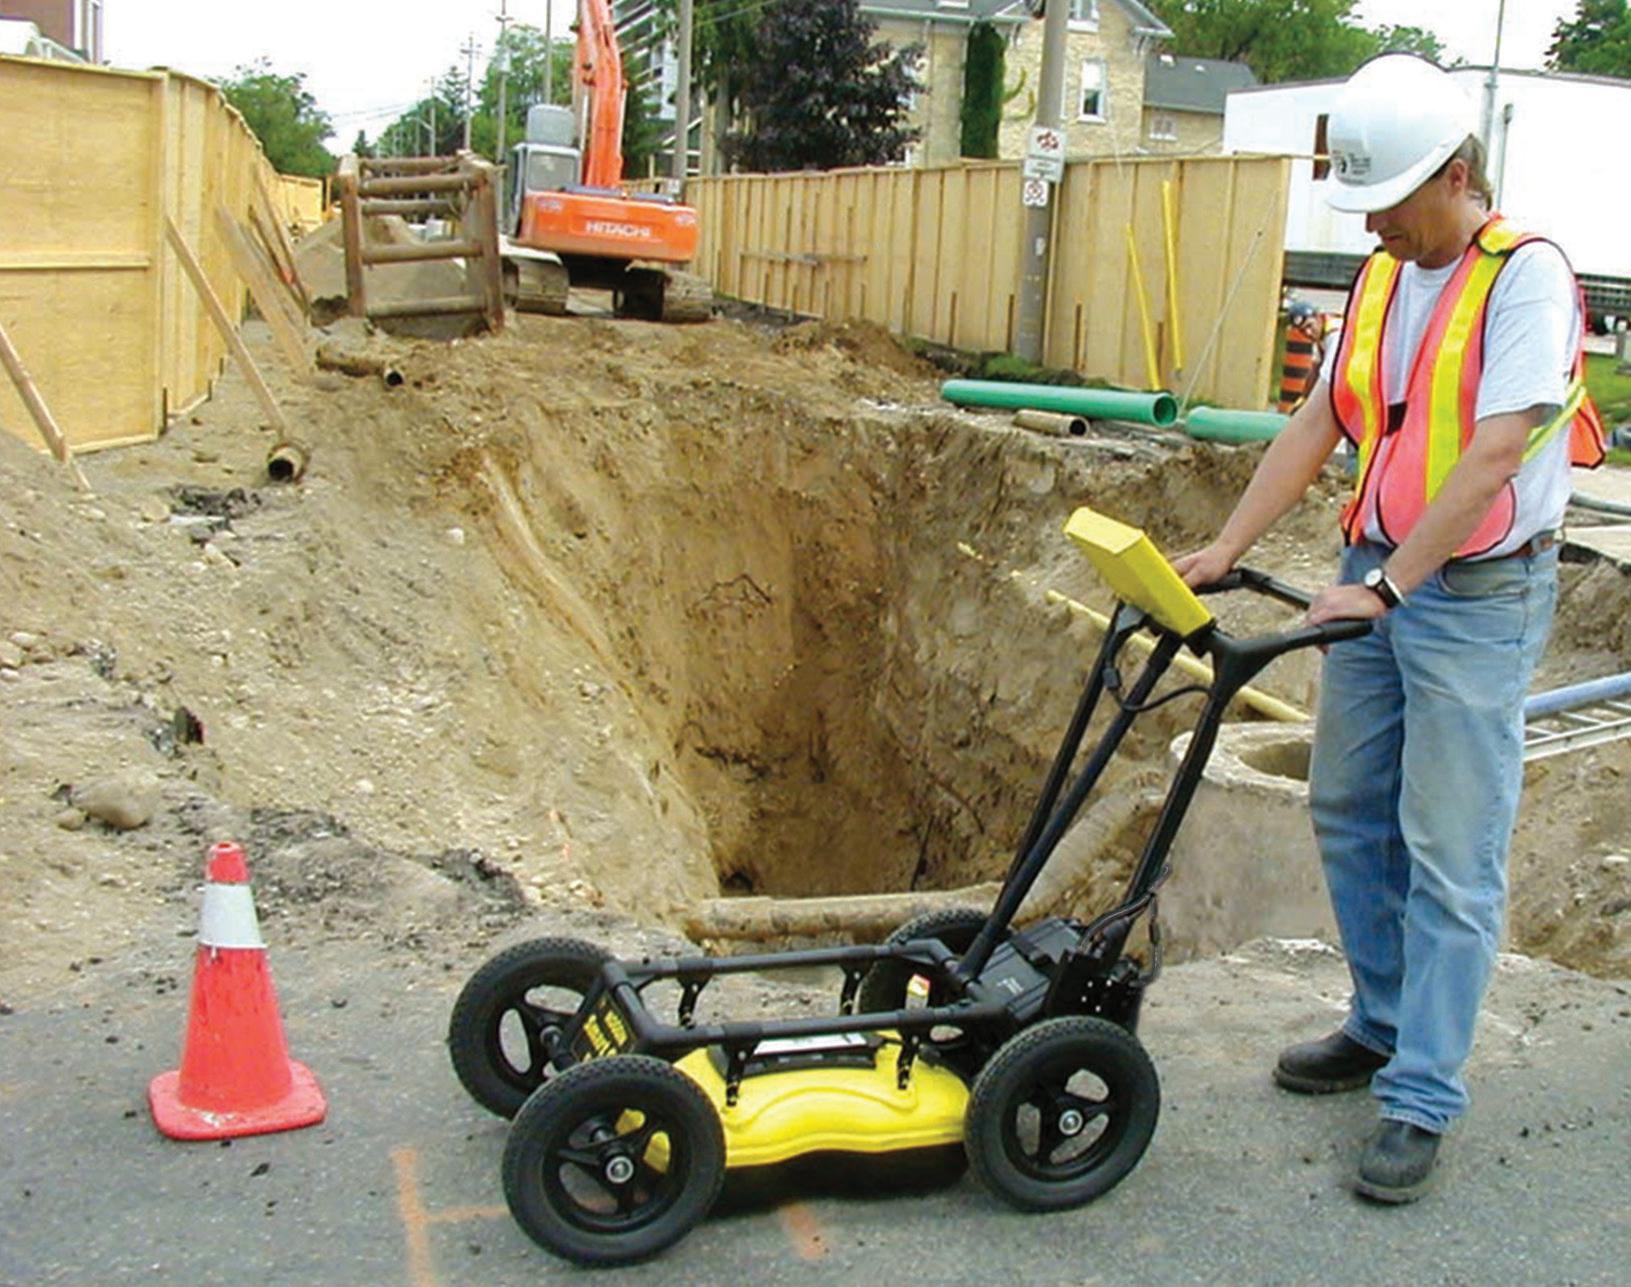
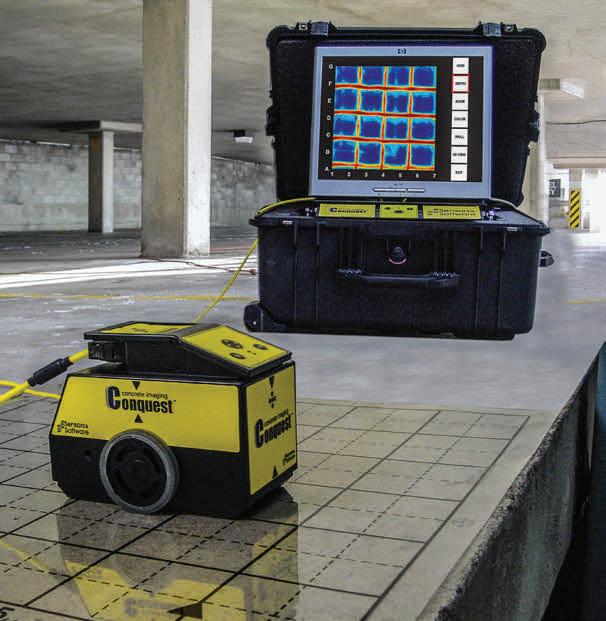
GROUND PENETRATING RADAR (GPR)
This non-destructive method sends short impulses of high frequency radio waves directed into the ground to acquire information about the subsurface. The energy radiated into the ground is reflected back to the antenna, distinguishing features that have different

electrical properties to that of the surrounding material. The greater the contrast, the stronger the reflection. It allows for detailed mapping of both the path and the depth of the utilities.
It can be used for subsurface mapping or to verify the information on an existing map.
This is used for locating large non-metallic services such as plastic gas or water mains, concrete pipes or services located under concrete slabs. It is not so effective for locating small domestic cables or pipes.
SECTION 25 WWW.UTILITYMAGAZINE.COM.AU UTILITY • FEBRUARY 2014
UTILITY LOCATION
After you dial, but before you dig
Advantages
GPR’s advantage is greatest when pipes are non-metallic and not readily located with traditional locating devices.
It is simple to deploy on-site and gives an immediate response visual with good depth estimate. It is self-contained and does not require hooking up to the utility and detects a variety of buried obstructions. It can sense both metallic and non-metallic structures
Things to watch out for
The frequency of the radar signal used for a survey is a trade-off. Low frequencies (250 MHz - 50 MHz) give better penetration but low resolution so that pipes and utilities may not be seen. Pipes and utilities may be seen using higher frequencies (500 MHz) but the depth of penetration may be limited to only a few feet especially in the wet, clayey soils. The GPR frequency is dependent upon the antenna. Once an antenna is selected, nothing the operator can do can increase the depth of penetration.
Radar data is ambiguous. Many buried objects produce echoes that may be similar to the echo expected from the target object. Boulders and debris produce reflections that are similar to pipes and tanks. Subtle changes in the electrical properties along a traverse caused by changes in soil type, mineralogy, grain size, and moisture content all produce “noise” that can make interpretation difficult. Interpreting radargrams is an art as much as a science.
Limitations
Performance can be affected in high-conductivity soils such as clay or salt-contaminated ground.
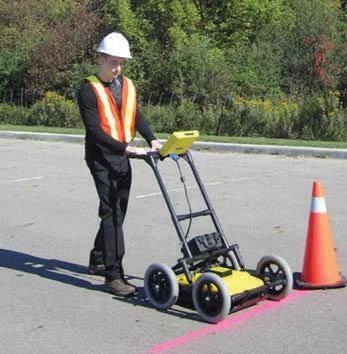
Traditionally, interpretation of GPR results was complex and required extensive training and expertise, however new products are now appearing on the market which are both lower cost and simpler to interpret.
A NOGGIN SMART CART WHICH HAS ENHANCED SOFTWARE GRAPHICS, THE ABILITY TO SAVE LONG LINES OF DATA AND TO DO GRIDS AND TO INTEGRATE GPS. IT ALSO HAS THE ABILITY TO CHANGE TO A CHOICE OF THREE OTHER ANTENNA FOR SPECIALIST WORK, OR BE DISASSEMBLED FOR SPECIALIST WORK IN MORE DIFFICULT SITES (E.G. ROUGH GROUND OR IN A LIVING ROOM FLOOR TO LOOK AT VOIDS UNDERNEATH)
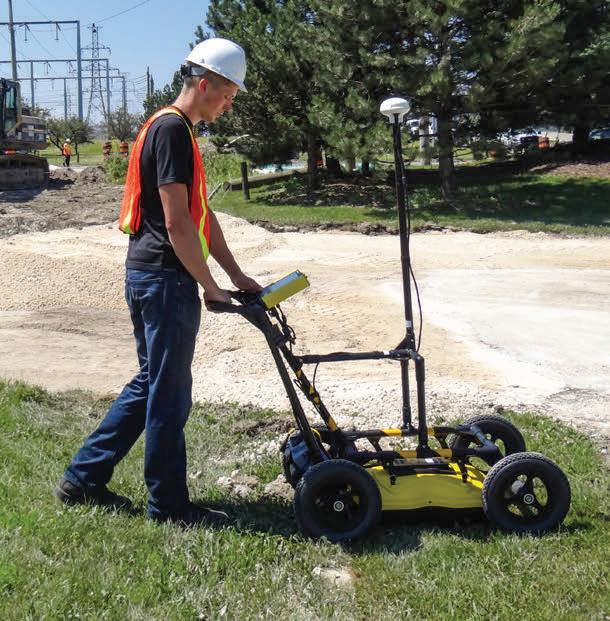
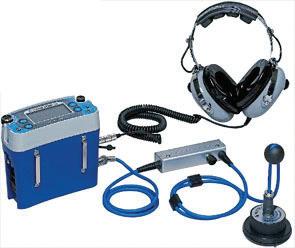
RADIO DETECTION/PIPE & CABLE LOCATORS
This uses a combination of transmitter and detector to locate services directly. Various methods are used to inject a radio signal into the service directly (metallic pipes and cables) or indirectly by pushing a copper cored duct rod into pipes or ducts and detecting a signal injected into the rod.
Advantages
Pipe and cable locators are normally simple to use and highly portable.
Radio detection is the most appropriate and cost effective method for most domestic and landscaping
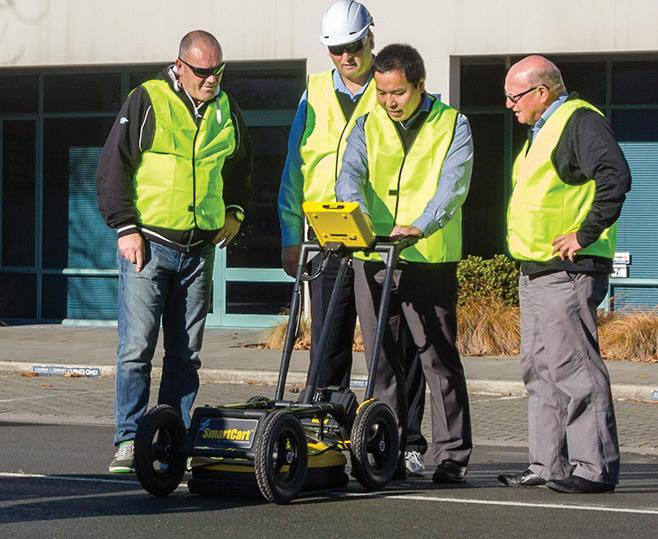
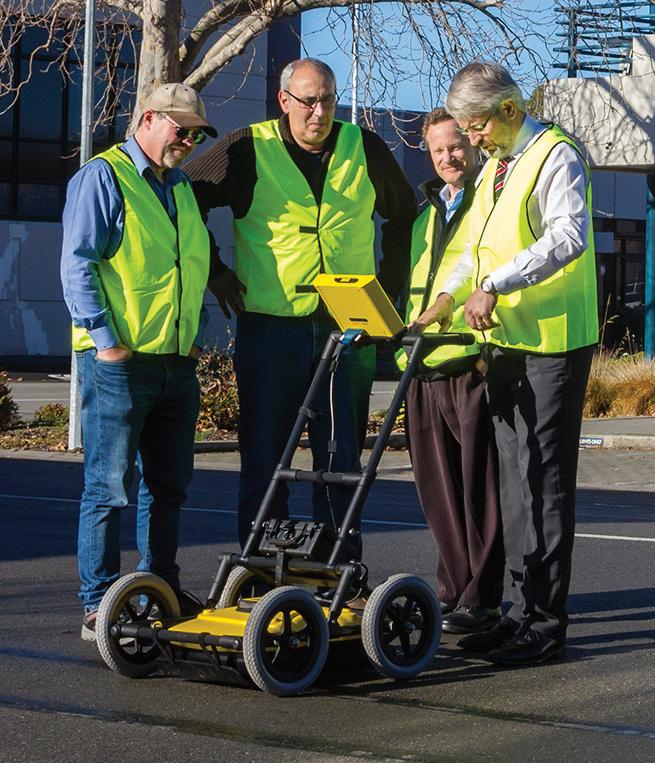
LORD CIVIL CONDUCTING A UNIQUE COMPETENCY-ASSESSED TRAINING COURSE IN CHRISTCHURCH
applications Limitations
This method is only effective in detecting metallic objects. Plastic gas services and mains as well as some fibre optic cables are buried with a trace wire so that pipe and cable locators can be used to locate them. They can also be subject to interference from other objects.
VACUUM EXCAVATION
In many cases it is necessary to expose the actual services to determine the precise location. This must be done in a non-destructive way.
UTILITY • FEBRUARY 2014 WWW.UTILITYMAGAZINE.COM.AU 26
UTILITY LOCATION
Leading suppliers of equipment & expertise to assess sub-surface utilities, roads, civil structures, & geophysical issues
• Ground Penetrating Radar...budget to professional. Meet new AS5488 requirements!
• Cable & pipe tracing units...models for all jobs
• Superb training & support
• Concrete rebar imaging equipment
• Australasia’s trusted provider with 17 years of service!
• Only the best brands.... ask for a quote www.lordcivil.com

SECTION BURIED
LOCATION
000 NZ: 0800 485 990
INFRASTRUCTURE
AUST: 1800 128
NEW ...10 watt 4 freq. Rycom 8879PLS 4yr Warranty Utlilty SmartCart
LMX100
NEW GPR’s ...low-cost LMX100 & new pro’s Utility Cart Conquest
After you dial, but before you dig
This method uses a truck or trailer mounted high volume vacuum pipe, often in conjunction with high pressure water jets to expose buried services. This method is usually used to prove service locations where multiple services are co-located in a dig site and can also be referred to as hydro-excavation, non-destructive digging (NDD), potholing or daylighting
Advantages
Vacuum excavation is often used in urban areas and around sensitive services such as high-voltage power or high pressure gas and optic fibres. The technique can also be used for broader excavation projects in high density areas.
Things to watch out for
A small risk of damage to the services still exists with vacuum excavation, and using the correct pressure is vital. The technique also creates a need for slurry disposal.
Limitations
Exposing a service still requires it to be correctly identified and it doesn’t necessarily limit the possibility of other unknown services nearby.
OTHER CONSIDERATIONS
There are many different types of equipment available to achieve similar outcomes but your service locator should provide the following:
1. The locator must be fully insured and experienced in the type of service location required.
2. Telstra Accredited Plant Locator (APL) accreditation is a legal requirement to locate Telstra assets and is a prerequisite for valid insurance cover.
3. Locating contractors should be members of NULCA the Locators association to ensure that they are kept up to date with legal and technical developments
4. Your locator should ensure that you are made aware of the
limitations of the equipment and the expected degree of accuracy of the locate.
5. Local conditions such as multiple services located together or heavy reinforcing in concrete slabs can interfere with locator signals and reduce accuracy.
6. Your locator should always discuss what they have found and marked with you or your staff on site.
7. Your locator should give you a cost estimate and a maximum that will be charged before starting the job.
This article was created with the help and advice of Detection Solutions, Lord Civil and Underground Locating Victoria. For more information contact Damien de Castella on 0417 327 570 or damien.decastella@gmail.com


UTILITY • FEBRUARY 2014 WWW.UTILITYMAGAZINE.COM.AU 28
UTILITY LOCATION
Just released easy to use MUST-HAVE tool

Make sure you are to excavate
e-Safe is a revolutionary tool that will change the way you locate all sub surface utilities (both metallic and non-metallic) prior to digging.
e-Safe uses proven GPR technology which can locate assets made from Asbestos, Fibre Optic, HDPE/PVC/MDPE, Clay/Brock as well as Balanced HV cable, Pot Ended cables, DC current cables as well as all assets the traditional cable avoidancetools can locate.
• Likelihood warning scale (HIGH, MEDIUM and LOW)
• Telescopic handle (folds down for easy transport/storage)
• High visibility screen (easily read in direct sunlight)
• Small footprint antenna


Contact us today: Ph 1300 885 383 Wakefield Centre 15/276 New Line Road, Dural NSW 2158 www.detectionsolutions.com.au Proudly developed by TM SUB-SURFACE DETECTION TECHNOLOGIES Service locators Leak detection GPR ALSO AVAILABLE
OPINION: THE TRIUMPHS AND PITFALLS OF THE NEW AS5488 STANDARD
By Anthony Johnstone, Access Detection
With the new AS5488 standards completed and in some cases already been utilised in the industry, I have been asked many times when training what these standards mean to a locator contractor.
With the new AS5488 standards completed and in some cases already been utilised in the industry, I have been asked many times when training what these standards mean to a locator contractor.
The most important thing about AS5488 is that it gives the locator contractor, the excavation operator and the surveyor a clear understanding of what is below the ground and how this is interpreted. In fact it is a good communication tool between all parties.
The standards for markings are split up into four classes QL-(A) sighted, QL(B) traced, QL-(C) aligned from surface features, QL-(D) any other method. This allows all operators on the project to understand the accuracy of the site location and map data when carrying out any kind of planning and excavation works. It can reduce costs by pre planning on projects
For example a class (A) marking indicates to the excavation operator that at that point the locator contractor has used a detection device, has excavated down usually with vacuum excavation and has identified the service at that point with a true depth by physically measuring the pipe.
A word of warning when a (A) class marking is found along a pipe or cable
route it is only at this point that you can be assured of the position and actual depth of the pipe or cable. It does not allow for variances of the cable route (twists or change in directions and or depth) between two points.
Another factor is that although you have excavated and identified a cast iron pipe, this does not always assure it is a water or sewer pipe. An area in an old estate was mapped, a galvanised pipe was identified through an excavation and was marked as water class (A). This pipe turned out to be an old conduit for the electricity lighting an easy and sometimes dangerous trap if you are not careful with tracing point to point.
A further example is a contractor using GPR to locate an area found two targets but could not confirm if the target was either water or sewer as they ran close together. Unlike a traditional pipe and cable locator were you connect to an actual point for example a hydrant and trace to another hydrant, GPR does not physically hook up to a service so unless a clear visual identification can be seen and a clear indication of the targets running from point to point vacuum excavation would be recommended to bring this type of locate to a class (A). Of course traditional pipe & cable locators can

also give you erroneous readings and an operator should be clear in each instruments strengths and training is a key part of the getting the best of these standards.
There are no standards for the type of equipment that can be used to detect services, anything from divining rods, pipe & cable locators to complex GPR antenna arrays can be utilised. The equipment and training dictates the quality achieved. Most professional companies that work to these standards will have an array of equipment at their disposal which can accurately identifies these services.
If you are looking at utilising companies that specialise in the new AS5488 standard a good place to start would be www.nulca.com.au this is an association dedicated to providing professional standards in locating, training and technology, quite a few companies in the association have already implemented the standard.
As a supplier and trainer of detection equipment we are able to assist our clients in selecting the best equipment for their needs. We offer both in house training or can offer fully accredited Australian industry recognised locator courses for our clients.
See page 77 for more detail on Access Detection
UTILITY • FEBRUARY 2014 WWW.UTILITYMAGAZINE.COM.AU 30
UTILITY LOCATION


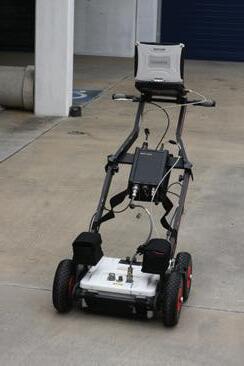


DIRECTIONAL DRILLING BRINGS GAS TO THE REGIONS
Construction work is currently underway to connect reticulated natural gas to the Victorian town of Huntly, north of Bendigo. The project is part of the Victorian Government’s Energy for the Regions program and is being carried out by SP AusNet.
Construction of the connection began in October 2013 and approximately 580 Huntly residents and businesses will have the choice of a cost effective, convenient and environmentally friendly energy supply by winter 2014.
SP AusNet’s Program Manager, Geoff Thorn, said the company is committed to delivering the underground gas network on time, safely and with minimal disruption to locals.
“I’m pleased to announce that work has started to supply natural gas to Huntly,” Mr Thorn announced in October 2013 as construction began.
“Crews are preparing to begin extending the underground pipeline from Bendigo along the Midland Highway to Huntly. Once we reach Huntly, we’ll then lay more than 13 kilometres of pipeline to homes and businesses throughout the town.
“During this construction phase, we’re committed to minimising any
disruptions to residents and safely delivering natural gas to their properties,” he said.
“Importantly, SP AusNet thanks the State Government for its support in bringing natural gas to Huntly through the Energy for the Regions program and we look forward to connecting more Victorians to our natural gas network.”
By late 2013, the supply main in Huntly was nearly complete, with more than 95 per cent direct drilled. On a technical level, the project is running smoothly and SP AusNet continues to use horizontal directional drilling (HDD), because it “allows us to go under or around nearly every obstacle we encounter.” These obstacles range from other utility services to tree roots and rivers or creeks. Emmett Drilling has been engaged as the HDD contractor for the works.
Open trenching is used where drilling is not possible or not the best
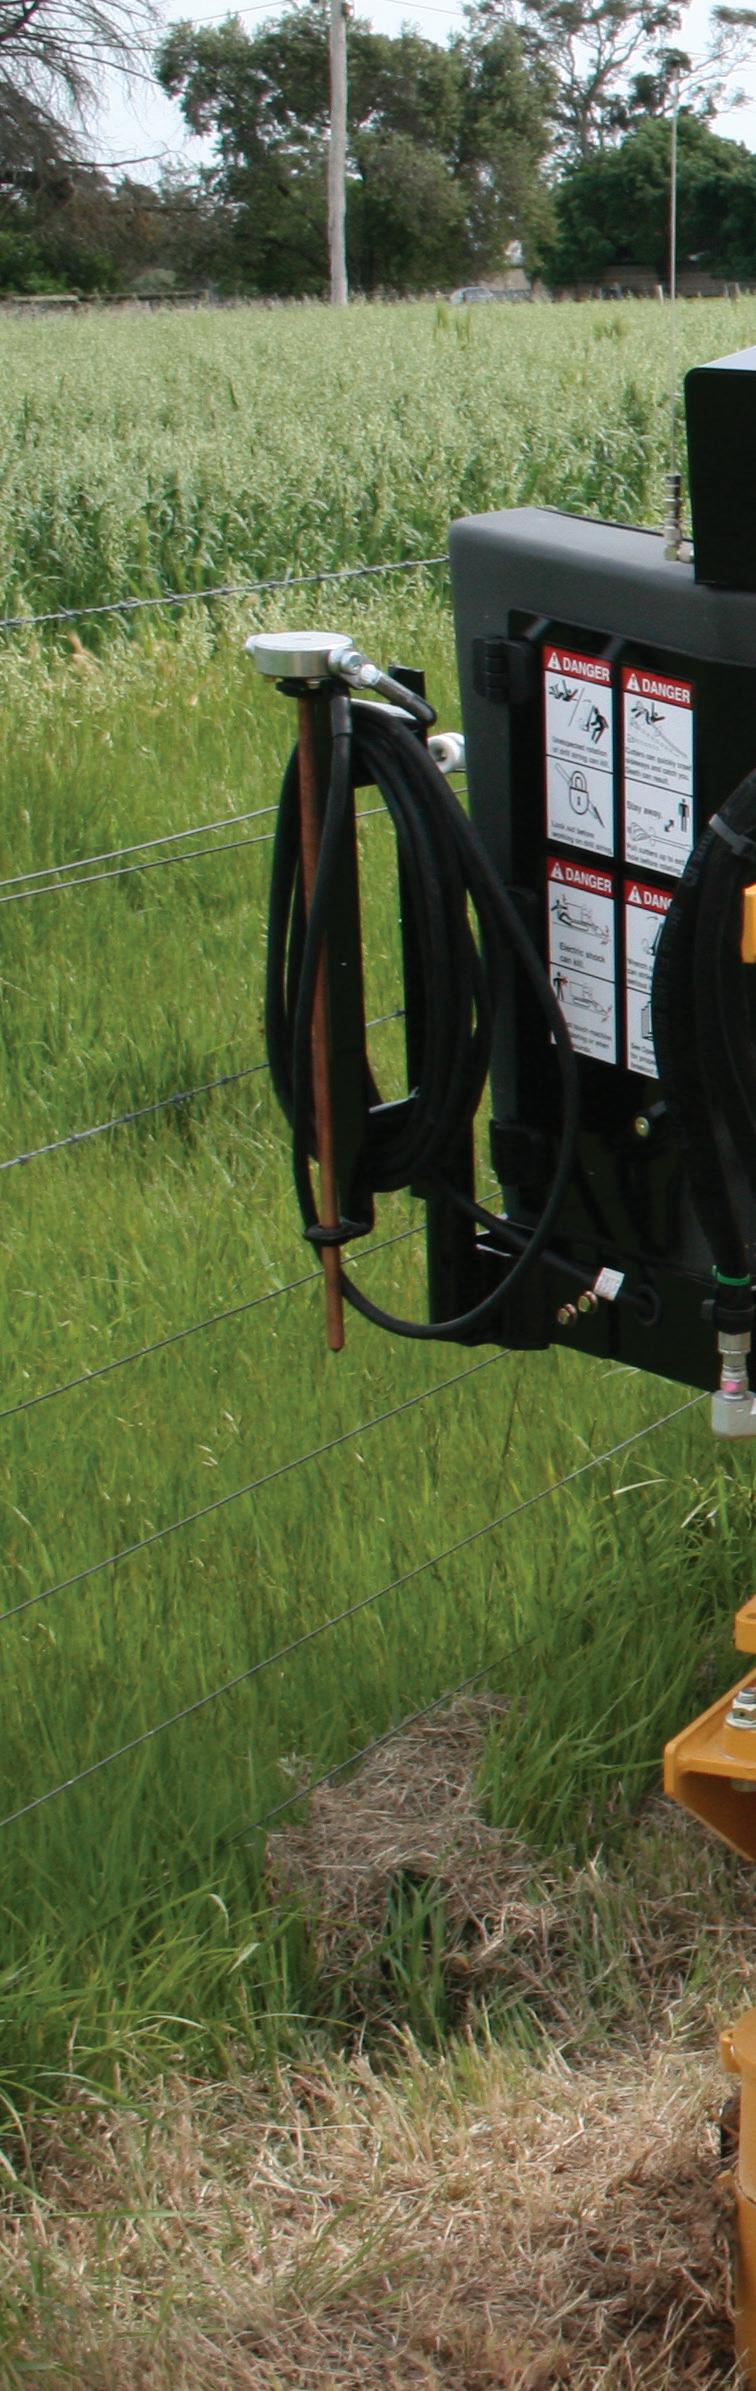
32 UTILITY • FEBRUARY 2014 WWW.UTILITYMAGAZINE.COM.AU
GAS
HORIZONTAL DIRECTIONAL DRILLING HAS PROVED TO BE A VERY ENVIRONMENTALLY FRIENDLY OPTION
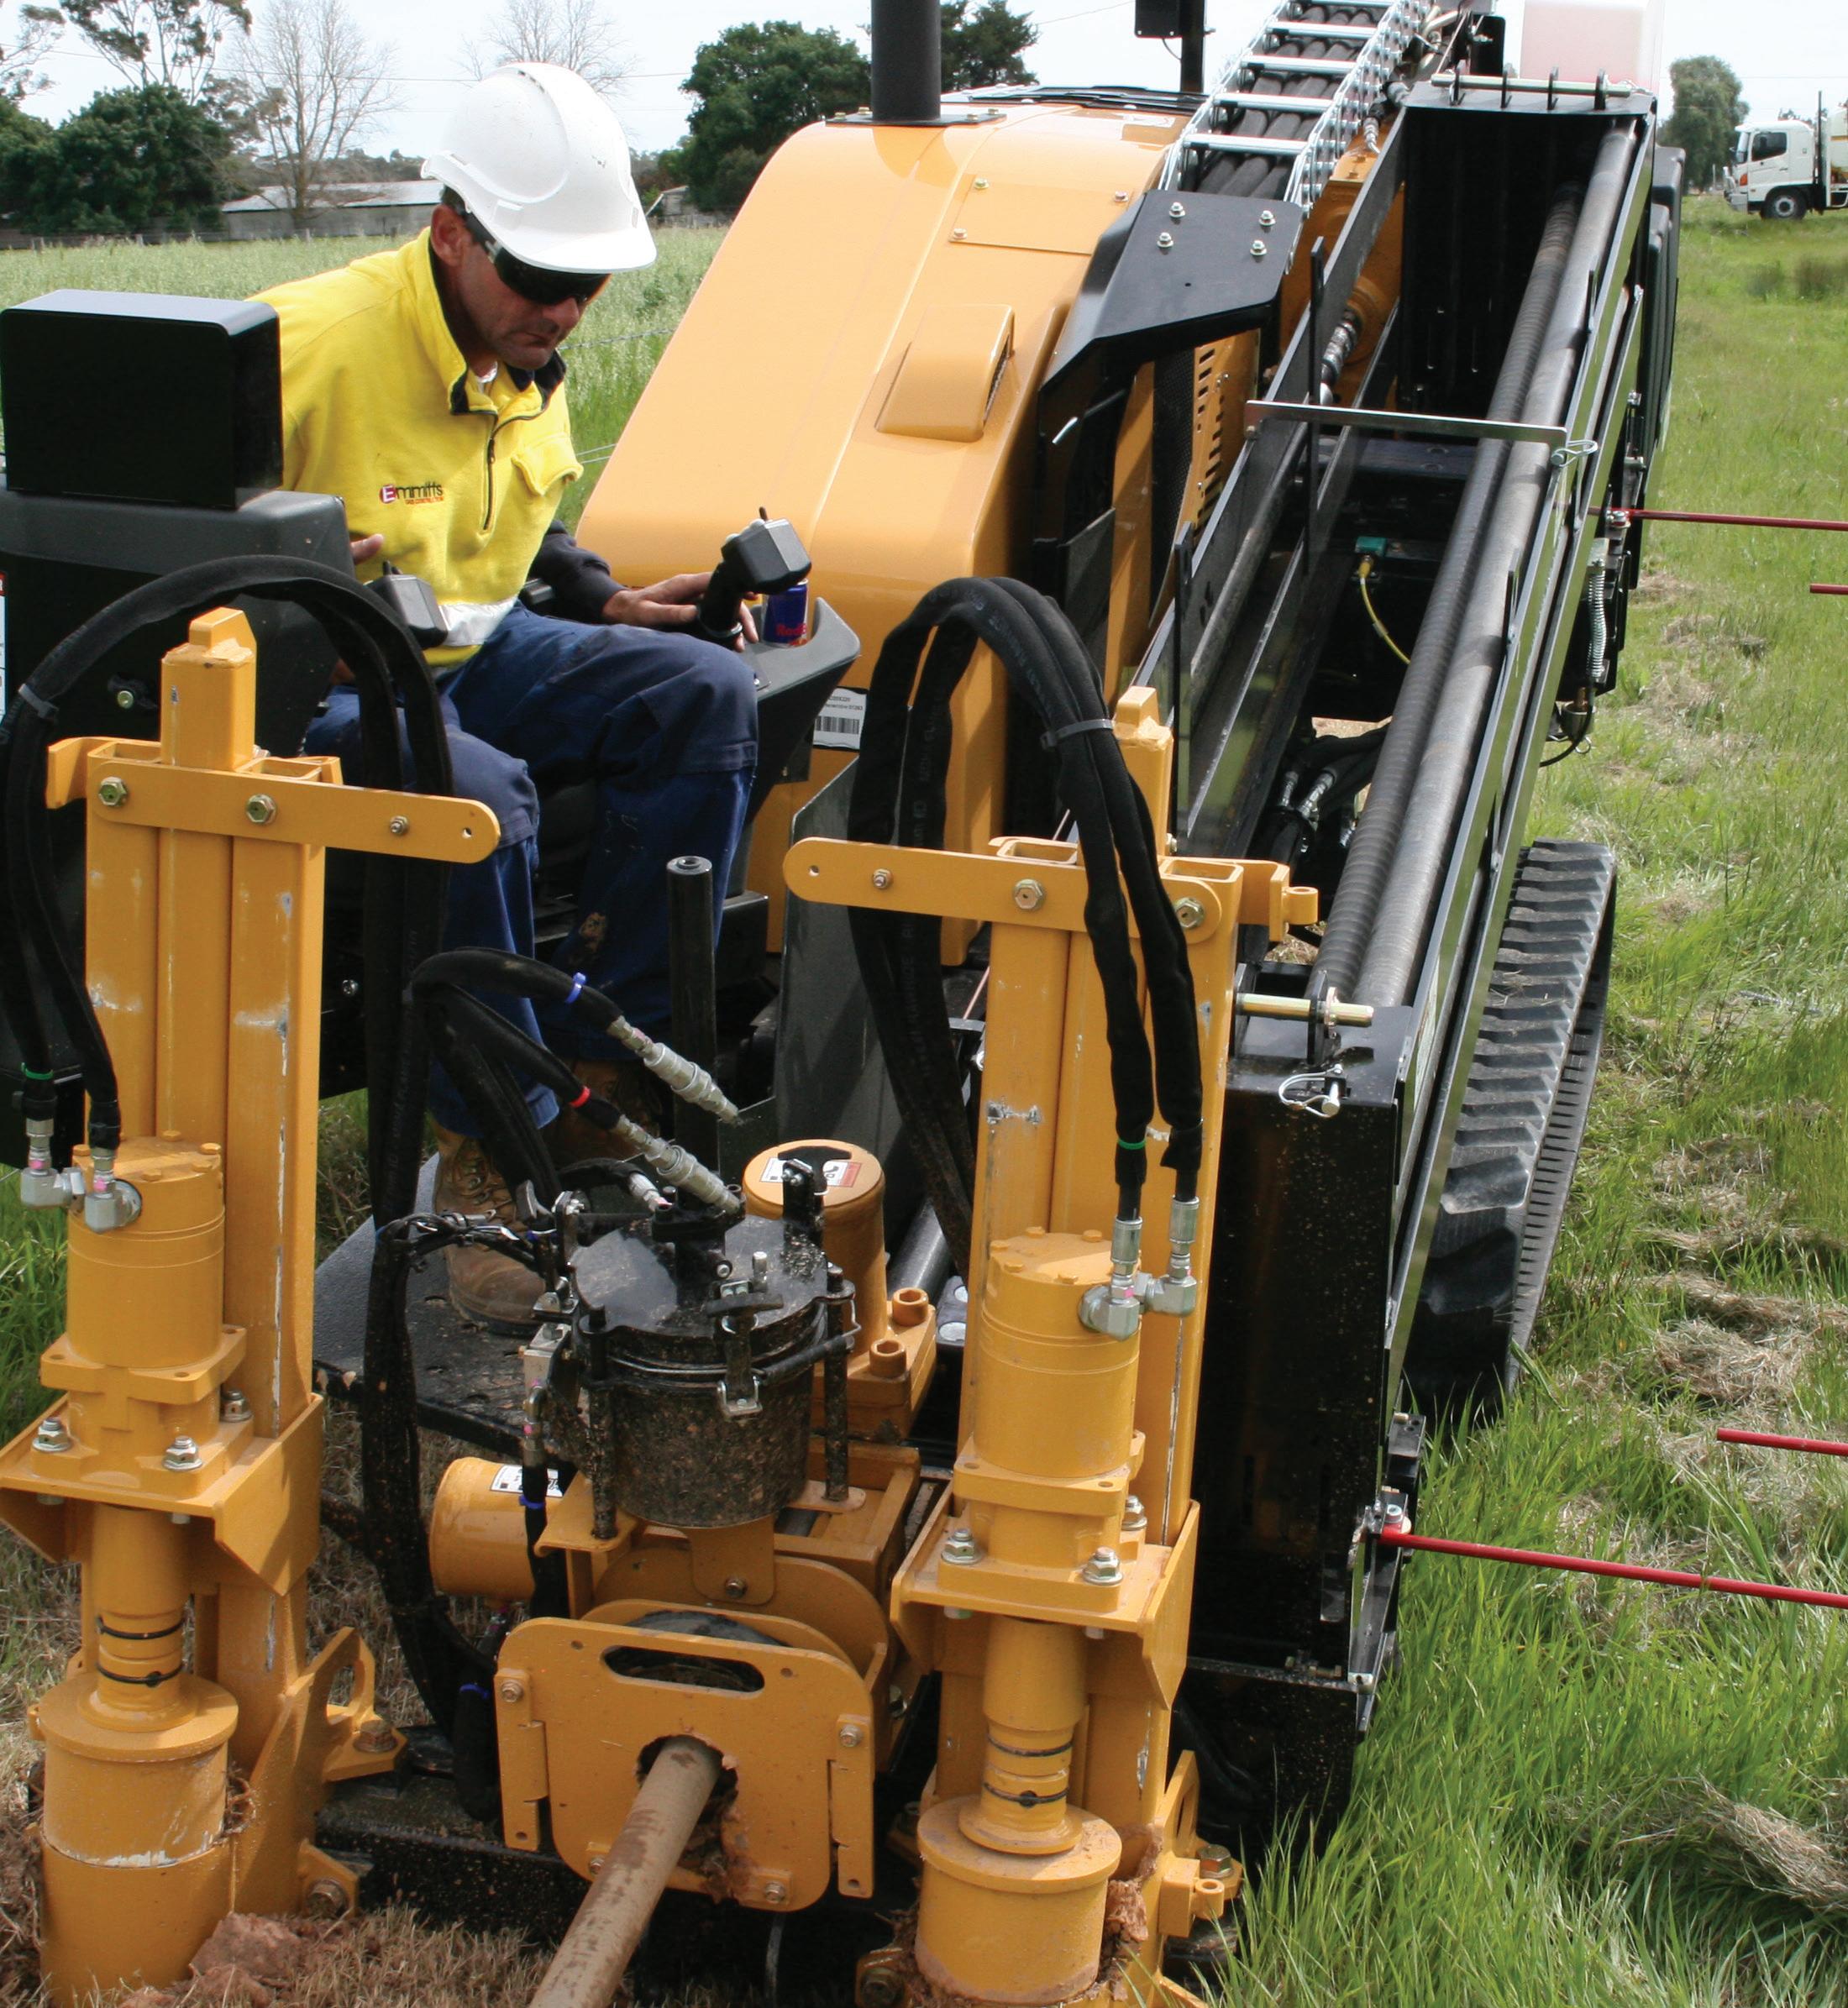
WWW.UTILITYMAGAZINE.COM.AU UTILITY • FEBRUARY 2014 SECTION 33 GAS
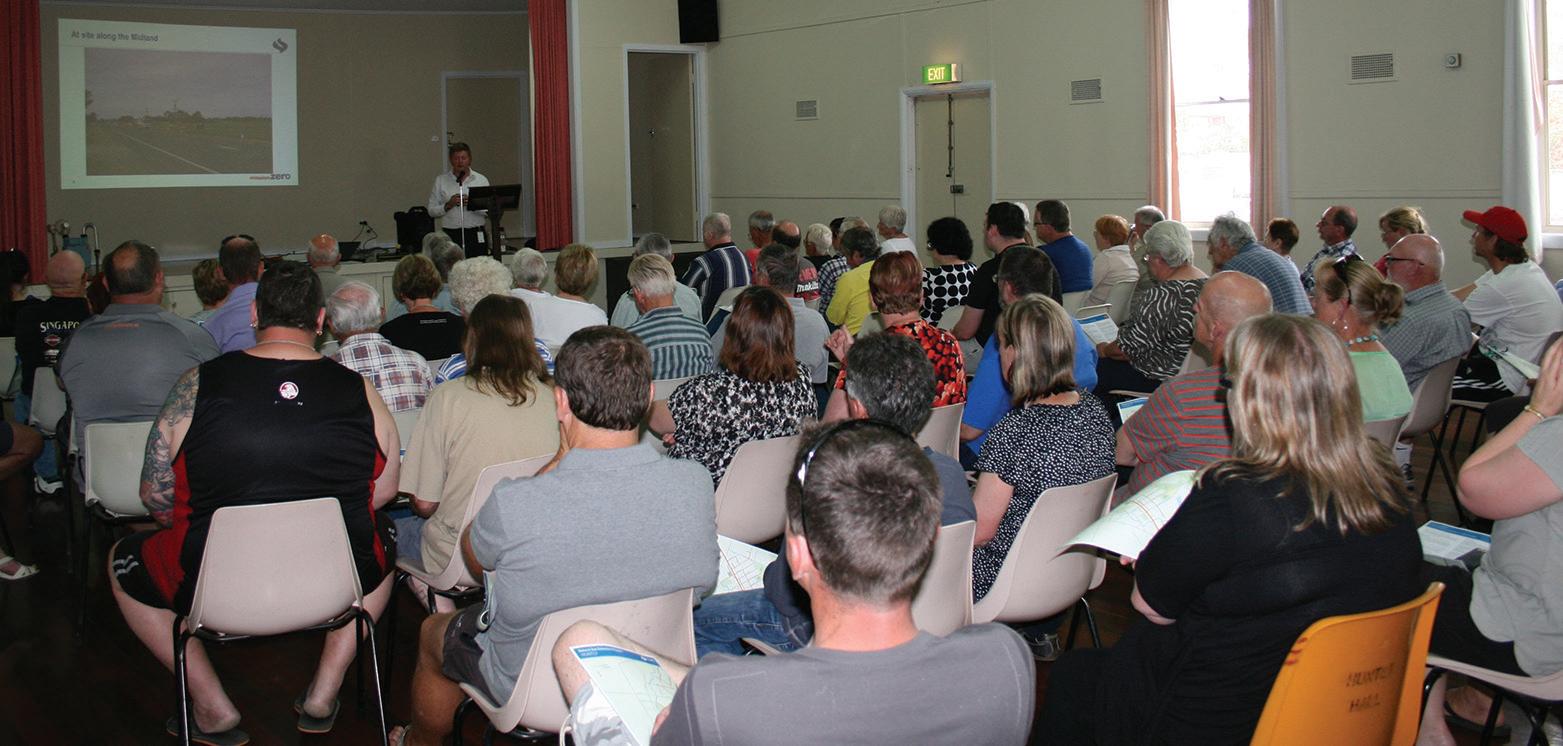
option, such as when they encounter rock or are close to other services that need consideration. While the rock can be drilled through, it makes maintenance of the pipe at a later date almost impossible. Instead, the rock encountered is hammered into small pieces, removed and replaced with a cleaner fill of more finely crushed rock.
All pipe laid is recorded on detailed maps which are filed in SP AusNet’s asset management system and also made available to the Dial Before You Dig service.
ENGAGING THE COMMUNITY
The key lesson SP AusNet has learnt from the previous gas extension program is the importance of engaging with the community – early and often. “This can overcome many of the concerns the community and lead to a greater take-up of gas. Tell everyone that needs to know what you are doing as soon as you can. That leaves plenty of time for negotiation and contingency plans if needed.”
The Energy for the Regions program brings natural gas to an area of the state that has never had it and history shows these towns tend to become more prosperous over time after gas is available.
As a result, it is an opportunity for the energy provider to simultaneously engage with older members of the community and young families about a common issue.
SP AusNet’s stakeholder engagement strategy is multi-faceted.
Discussing their strategy in Huntly, they explained, “We have written to all residents advising them of our project. We have also erected large signs at each end of town advising what we are doing. In November, we held a community forum to provide detailed project information and answer specific question from the attendees. We used posters in the local stores and post office to advertise this event. We maintain our website and have a dedicated phone number and email Directional drilling brings gas to the
UTILITY • FEBRUARY 2014 WWW.UTILITYMAGAZINE.COM.AU 34
GAS SAWMILL RD SAWMILL RD HUDDLE RD PITT ST WARATAHRD EAST RD EAST RD RENNIEST TECOMACRT HAKEARD GUNGURRURD STEPHENSONST BURGOYNEST PASLEYST AIREY ST O’SULLIVANS RD STATION ST HOLMES RD LIGARST PITSONCT HUNTLY–FOSTERVILLERD RUEDINSRD BUCKLEYS LANE LEANS RD MIDLANDHWY MIDLANDHWY MIDLAND HWY BURGOYNE ST BRUNELST BRUNELST TELFORDST RENNIEST DENILIQUINTRAINLINE BENDIGO REGIONAL PARK BENDIGO REGIONAL PARK BENDIGO REGIONAL PARK HUNTLY PRIMARY SCHOOL GREENEST HEHIR RD SARGEANTS RD GREVILLEARD EGANS RD SHIRLEYCRT LAVENIARD VIOLA RD BORONIA RD DEEPLEADRD
Gas
HUNTLY Gas Mains Reticulation N THE COMMUNITY INFORMATION NIGHT WAS A KEY PART OF THE STRATEGY TO ENGAGE WITH THE LOCAL COMMUNITY
regions
Natural
Extension Program
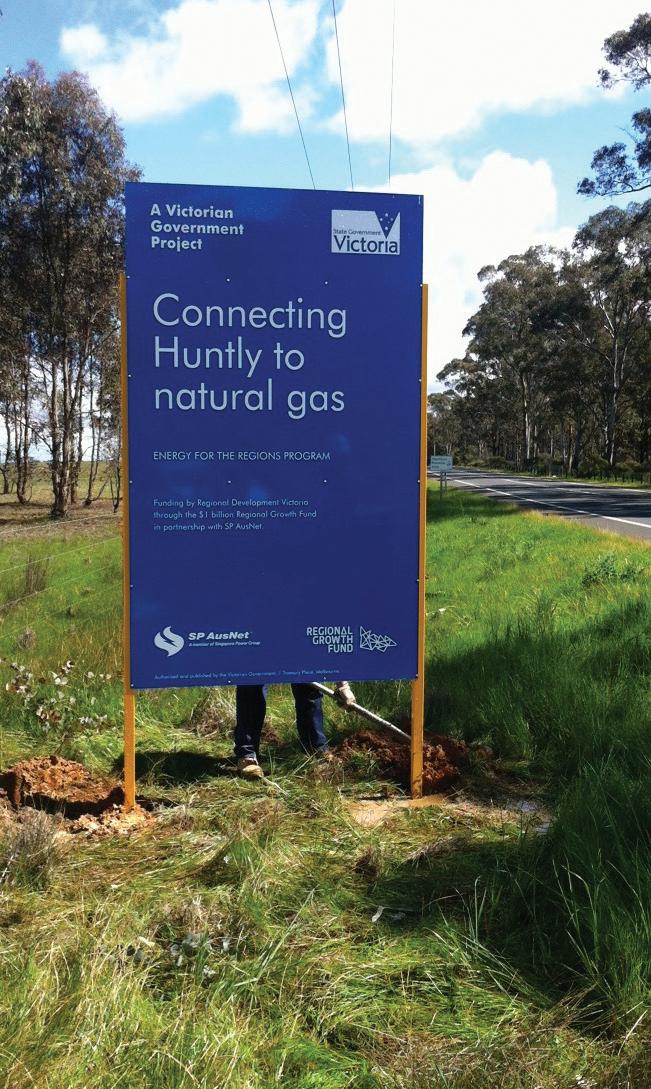
address to manage enquiries.
“We also have several contacts within the local council (City of Greater Bendigo) that we keep up to date. That way if residents make enquiries to council, the council is across the project. As part of the planning approval stage we also engaged very closely with the local VicRoads office and Dja Dja Wurrung Aboriginal clan regarding Cultural Heritage issues.”
Ensuring the project has a minimal impact on the environment is another challenge, but also a great positive for the community as well. SP AusNet has engaged an ecological adviser and a Cultural Heritage advisor to ensure that environmental issues on a state and federal level have been considered and all necessary permits have been sought. In Huntly, they have an agreed (with DEPI) Net Gain offset plan. Any no-go zones along the route where the pipes are to be laid have been identified.
Importantly, the HDD technique used to lay the pipe is very friendly to
Directional drilling brings gas to the regions
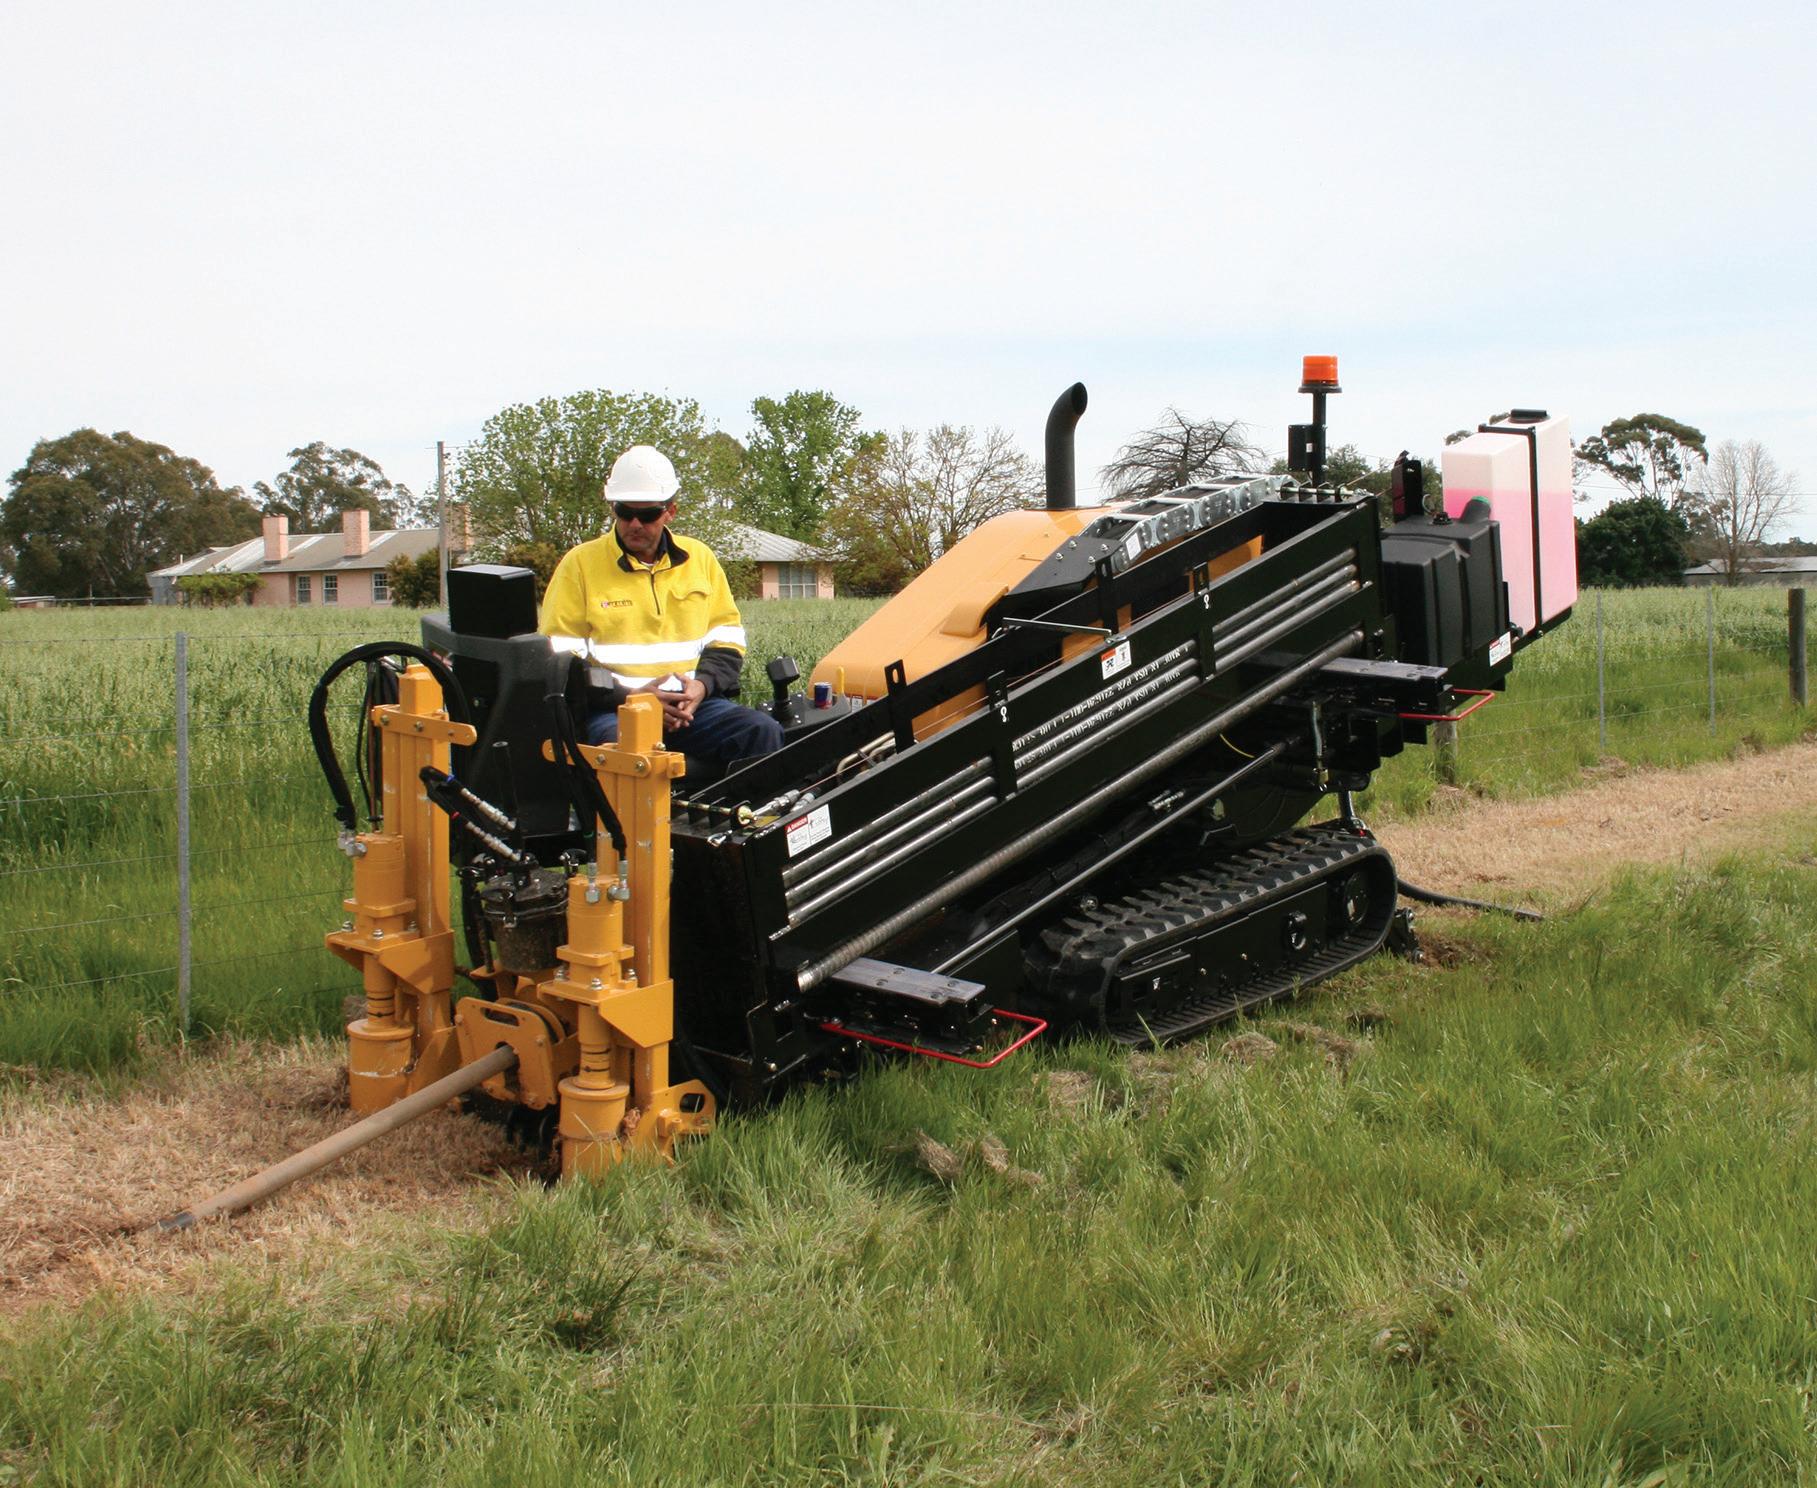
the environment.
Safety is another key consideration. SP AusNet has a service provider panel of contractors that deliver almost all of their capital works –mains renewal and new estates. SP AusNet’s operation and maintenance and minor works are outsourced to a single contractor following a competitive tender process. “Safety is the primary consideration in everything we do at SP AusNet, including which contractors we employ.”
WHAT IS THE ENERGY FOR THE REGIONS PROGRAM?
The Victorian Government launched the Energy for the Regions program to supply natural gas to 14 targeted regional and rural Victoria towns.
The government has committed $100 million to the program, which will explore the viability of connecting natural gas to new regions by extending the existing underground distribution network or through non-traditional means.
Regional Development Victoria (RDV) is delivering the program on behalf of the government.
In addition to its ongoing expansion of the network, SP AusNet has agreed to extend its gas network to several towns identified by the program.
To date, SP AusNet has an agreement with RDV to extend its 10,000 km reticulated natural gas network to:
• Huntly;
• Avoca;
• Bannockburn; and
• Winchelsea.
In the last five years, SP AusNet has carried out works costing more than $580m in operating, maintaining and extending its natural gas network to 92,000 new homes and businesses.
This included connecting 15,000 properties as part of the State Government’s previous natural gas extension program in 12 Victorians towns (Barwon Heads, Camperdown, Creswick, Gisborne, Lancefield, Macedon, Maiden Gully, New Gisborne, Port Fairy, Riddells Creek, Romsey and Woodend).
WWW.UTILITYMAGAZINE.COM.AU UTILITY • FEBRUARY 2014 SECTION 35
GAS
LARGE SIGNS EXPLAINING THE PROJECT WERE ERECTED AT EACH END OF TOWN
SCADA HELPS ERGON IMPROVE NETWORK RELIABILITY
Queensland regional electricity distributor Ergon Energy has improved network reliability and is future-proofing its network. Deploying SCADA is helping achieve results.
Ergon has a Network 2030 Vision to enhance real-time monitoring and control of its systems in order to respond to events, as well as deliver a self-healing network that automatically identifies, isolates and responds to system disturbances and faults
Two initiatives making this happen are part a company-wide reliability improvement program and includes Supervisory Control and Data Acquisition, or SCADA, and an all-encompassing or ‘ubiquitous’ telecommunications network called Ubinet - that today links 40 depots and 90 substations.
Ubinet uses both Ergon’s and other parties’ infrastructure to maximise the efficiency of investment. These parties include Powerlink, Queensland Rail, Nextger and commercial carriers where suitable. Building the Ubinet network involved the construction and installation of more than 55 telecommunication shelters, 73 communication poles, and 33 telecommunication towers and masts around the state.
The first of the Ubinet implementation was completed in late 2012. The second phase, which involves the replacement of analogue two-way radio network with a P25 digital radio system integrating voice, GPS and Telemetry Data capability, is expected to be complete by 2020.
By August 2013 Ergon’s SCADA system was providing monitoring and supervisory control for 729 distribution re-closers and more than 400 of its 500 zone substations. SCADA is now present in 86 per cent of Ergon’s substations and covers 93 per cent of feeders on the network. Operational Control Centres in Townsville and Rockhampton monitor the system of Local Control Facilities (LCFs) within the substations and a centralised master station.
ELECTRICITY 36 UTILITY • FEBRUARY 2014 WWW.UTILITYMAGAZINE.COM.AU
IMPROVE RELIABILITY
Presently the standard Remote Terminal Unit (RTU) is the Invensys (Foxboro) SCD5200 (C52). The C52 has been used by Ergon Energy since 2004 and accounts for 66 per cent (522/789) of RTUs in service. There are a wide variety of RTUs, installed prior to 2004, which have limited or no intelligent capabilities. Hardwired input alarms are sent to, and output controls received from, the control centre. In addition to hardwired inputs and outputs, the C52 RTU communicates to Intelligent Electronic Devices (IEDs) performs automated control routines and provides the interface to the master station and the LCFs.
There are several automated substation business-as-usual routines performed within the SCADA system. These are done as calculations within the RTU and are based on standard designs and customised for the site where applicable. Ergon uses standard designs for Automatic Voltage Regulation (AVR) and Capacitor Automatic Control in addition to several site specific routines used for Load Shedding, Plant Overload Protection, Auto Close, Auto Reclose, and SVC control.
A Distribution Management System (DMS) is the foundation information and decision support system for the deployment of intelligence in the distribution network. As part of its desire to reduce upward pressure on prices by reducing operational expenditure while increasing reliability standards, Ergon is currently evaluating tenders for purchase of a DMS solution which would herald increased automation and support for new technologies. Besides efficiency, a suitable DMS will also improve business continuity, enable a smarter network, allow the company

SECTION
ELECTRICITY 37 WWW.UTILITYMAGAZINE.COM.AU UTILITY • FEBRUARY 2014
ELECTRICITY
SCADA helps Ergon improve network reliability
to improve quality of supply, improve safety outcomes and enhance Ergon Energy’s customer interaction.
Deployment of a DMS application package will involve change within the operational sphere, coupled with extensive data cleansing and capture. This will be the first stage of an ongoing DMS installation strategy to progress Ergon on the Smart Grid path, which will require communication with as many distribution devices as necessary in order to obtain the most complete picture of the network in real time. In addition to the devices that are currently being monitored by the existing SCADA system, this includes the deployment of and communications to line fault indicators, intelligent grid monitors, sectionalisers (and other switching devices), voltage regulators, capacitors, embedded energy resources, distribution substations and potentially other distribution equipment.
Having Ubinet as an ubiquitous telecommunications network has enabled Ergon to meet its core network performance targets, protect electricity assets, enhance community safety, and significantly reduce reliance on commercial carriers. Other benefits from the initiative include rapid identification of power network faults (meaning faster restoration to customers when faults occur) efficient and accurate monitoring and control of Queensland’s power grid, and enablement of an independent telecommunications network that can be used in disaster response situations when commercial carrier networks may be congested or damaged.
Customers in regional Queensland are now enjoying the benefits of increased network investment over the past decade with dramatic improvements in both the frequency and duration of power supply interruptions. Outages across the network declined by 37 per cent between 2005-06 and 2012-13 with the average amount of time customers spent without power falling 36 per cent.
On average, Ergon’s customers experienced 2.8 outages a year, lasting 5.7 hours in total. This was equivalent to customers having power supply available 99.935 per cent of the time in the year. Customers experienced, on average, 4.5 hours of unplanned outages and 1.28 hours of planned outages during 2012-13.
These reliability improvements reflect the significant investment and priority Ergon Energy has placed into improving customer service and achieving the Minimum Service Standards in line with its regulatory requirements.
Chief Executive Ian McLeod said Ergon Energy had introduced a range of programs since 2004-05 to improve reliability in response to the findings of the first Somerville inquiry.
In addition to the SCADA program, other measures include:

• A significantly increased vegetation management program that removes trees or branches within specified corridors around power lines. This is being further enhanced and delivered more cost effectively though the use of 3D aerial data capture and virtual modelling technology (ROAMES) to monitor vegetation clearances from power lines.
• Regular asset inspection cycles to identify equipment at risk of failing and then replacing or repairing it before an unplanned outage occurs.
• Greater redundancy in the network, especially for supplying larger population centres. In some locations, this means a substation can maintain supply to customers if one of its transformers is out of operation, or that a key high-voltage power line may be duplicated.
• Greater co-ordination and packaging of works to maximise outcomes during planned outages.
• Increased use of generators for planned outages and disaster response.
• Augmenting the capacity of the network to cope with peak loads without shedding customers on the hottest and coldest days of the year.
• Increased number of switches and ties on the network, enabling smaller sections of the network to be isolated for repairs while power is maintained or reinstated to most customers from another feeder line.
• Detailed storm and cyclone season preparations, covering both preventative maintenance and staff planning for various disaster scenarios.
• Using weather forecasting services to predict storm activity and prepare additional resources to respond to faults.
• Refurbishment and replacement of aged assets.
Mr McLeod said these investments had produced tangible benefits demanded by customers and regulators from a reliability perspective.
However, he also said that the level of investment was
UTILITY • FEBRUARY 2014 WWW.UTILITYMAGAZINE.COM.AU 38
unsustainable in an environment where demand and consumption were contracting and customers were substituting some of their energy needs through other means, such as solar PVs.
Also, further increased spending across the board would not deliver the same degree of improvement as in the past.
“We also acknowledge that this increased investment over the past eight years has been among the factors contributing to higher electricity prices,” he said.
“Our customers are telling us they are now generally satisfied with reliability levels and are more concerned about affordability.
“While we will continue to invest in the network where prudent to improve reliability and efficiency, it will be carefully targeted to ensure greater productivity per unit of energy.
“We are now focused very much on our worst performing feeders, often the long SWER (Single Wire Earth Return) lines in rural areas, and looking for cost-effective ways of improving reliability and quality of supply for those customers.
“For a number of years, we have been trialling battery systems to support peak load and maintain supply quality and this has proven successful.
“The outcome is a broader roll out of this technology and greater savings on the traditional infrastructure solutions.
SCADA helps Ergon improve network reliability
“For the majority of our customers though, our goal is to maintain their existing standards of reliability, while restraining our overall expenditure so the network component of prices rises from 2015-16 is below the rate of inflation.”
ABOUT ERGON ENERGY
Ergon is a Queensland Government-owned corporation which supplies electricity to around 710,000 customers across an operating area of more than one million square kilometres – around 97% of the state of Queensland –from the expanding coastal and rural population centres to remote communities of outback Queensland and the Torres Strait.
Ergon Energy’s electricity network consists of approximately 160,000km of powerlines and one million power poles, along with associated infrastructure such as major substations and power transformers. The company owns and operates 33 stand-alone power stations that provide supply to isolated communities across Queensland which are not connected to the main electricity grid. Since August 2007, Ergon Energy has owned and operated the Barcaldine gas-fired power station along with its associated infrastructure, which supplies power to the main grid. Ergon Energy has around 4,600 employees and an $11.5 billion asset base.
More information can be found at https://www.ergon.com.au/about-us/company-information/corporate-profile

WWW.UTILITYMAGAZINE.COM.AU UTILITY • FEBRUARY 2014 SECTION 39
ELECTRICITY

40 UTILITY • FEBRUARY 2014 WWW.UTILITYMAGAZINE.COM.AU
ELECTRICITY
POWER GOES UNDERGROUND
UNDERGROUND
IN THE WEST
For over a decade, Western Power has been undertaking an extensive program to put powerlines underground throughout Western Australia. Around 18 per cent of the overhead distribution network existing at the start of the program in 1996 is now underground, including 54 per cent of the Perth metropolitan area.

41 WWW.UTILITYMAGAZINE.COM.AU UTILITY • FEBRUARY 2014
ELECTRICITY
Power goes underground in the west

Before After

After significant damage was caused to Western Power’s overhead network during very severe storms in 1994, the WA State Government established the State Underground Power Program (SUPP) to convert areas of overhead wires and poles to underground. A Steering Committee, comprising the Public Utilities Office (previously the Office of Energy), Western Power and the WA Local Government Association, was established to manage the program.
Pilot projects involving around 7,000 households were successfully carried out in Applecross, Albany, Cottesloe/ Claremont and Wembley between 1996 and 1999.
In 1998, the Minister for Energy announced that the program would continue and invited local councils to apply for projects within their area to be considered for funding. The selected projects became Round One of the State Underground Power Program (SUPP).
The recognised benefits of putting power underground include fewer blackouts during inclement weather, enhanced visual appearance, improved property values, reduced street tree pruning requirement and brighter, safer streets with the new lighting system.
There are two streams to the SUPP - Major Residential Projects and Local Enhancement Projects. MRPs are usually around 600 to 1000 properties in residential areas while the LEPs usually underground around a kilometre of roads such as main streets in country towns, council areas in the metropolitan area, or areas of historical or heritage significance.
So far 41 residential projects and 30 LEPs have been completed in the SUPP, costing around $315 million. Around 78,000 electricity meters have been converted to underground.
The success of the program is due in part to the funding arrangements. It is a State Government initiative managed by the State Underground Power Steering Committee
based at the Public Utilities Office and includes representatives from the Public Utilities Office, Western Power and the WA Local Government Association. Western Power manages the work in each Project.
Local Councils can nominate areas to be converted to underground power. Each nomination is assessed against social, economic and technical criteria by the SUPP Steering Committee. The State Government and Western Power each contribute about $10 million to the annual SUPP budget of $40 million.
Generally, the cost of each MRP is shared between the State Government (25%), Western Power (25%) and the Local Councils (50%). Local Councils usually pass their responsibility to the property owners in the project area who gain significant advantages from the conversion of the power system to underground. The funding for LEPs is similar to MRPs but the State Government and Western Power contributions are capped at $500,000 each. In areas that meet certain Socio Economic Index For Areas criteria from the Australian Bureau of Statistics, the responsibility of the Local Council is reduced from 50% to 35%.
In each project, a new street lighting system designed to the Australian Standard is installed. There are around 10% more lights installed than are removed with the old overhead system. The new lights are more closely spaced, generally alternated from one side of the road to the other, and placed around a metre from the kerb to provide more light to the roadway. The steel light poles will collapse when hit by vehicles to reduce damage and injuries.
SCOPE OF WORKS
Generally each project involves the following works;
• Laying of new power cables underground - usually in the road verge
• Installation of green connection pillars, usually in the front corner of private property which serve that
UTILITY • FEBRUARY 2014 WWW.UTILITYMAGAZINE.COM.AU 42
BEFORE AND AFTER PHOTOS FROM THE PROJECT IN ATTADALE SOUTH (COMPLETED IN 2012)
ELECTRICITY


property and the immediately adjacent property wherever possible.
• Installation of transformers and switchgear units to manage the distribution of power throughout the area. These are located in parks or public open space, or where required, on side verges of residential property.
• Installing an underground connection from the connection pillar to the meter box at each property.
• Installation of a new street light system designed to meet Australian Standards as closely as possible.
• Removal of existing wooden poles and overhead power lines (excluding Transmission lines and poles)
A TRENCHLESS SOLUTION
About 98% of the works are done by directional drilling. Trenching is only used around corners or when rocky outcrops are encountered. The extensive use of directional drilling helps minimise the impact on residents and keeps reinstatement costs low.
Western Power uses contractors who will first install the Transformers and Switchgear Units. The main cables are then installed around a metre deep under the verges using horizontal boring technology to reduce the impact on lawns and reticulation systems. The connection pillars are then installed and connected to the main cable and become live once the network is fully connected, tested and commissioned. Cables are also installed, where required, to connect the pillar to each meter box. After the pillars in each area are energised, each property is then changed over to the new underground system.
A range of equipment is used in the construction process. The mains cable drilling (both high voltage and low voltage distribution) uses horizontal boring machines and a range of smaller drills are used for cross road shots or where space is restricted. Other equipment includes diggers and bobcats for joint and drilling flow holes; hiabs, cranes and EWPs


WWW.UTILITYMAGAZINE.COM.AU UTILITY • FEBRUARY 2014 43
AND
IN 2012) Power
in the west ELECTRICITY Before
After
BEFORE
AFTER PHOTOS FROM THE PROJECT IN ATTADALE SOUTH (COMPLETED
goes underground
After Before
Power goes underground in the west
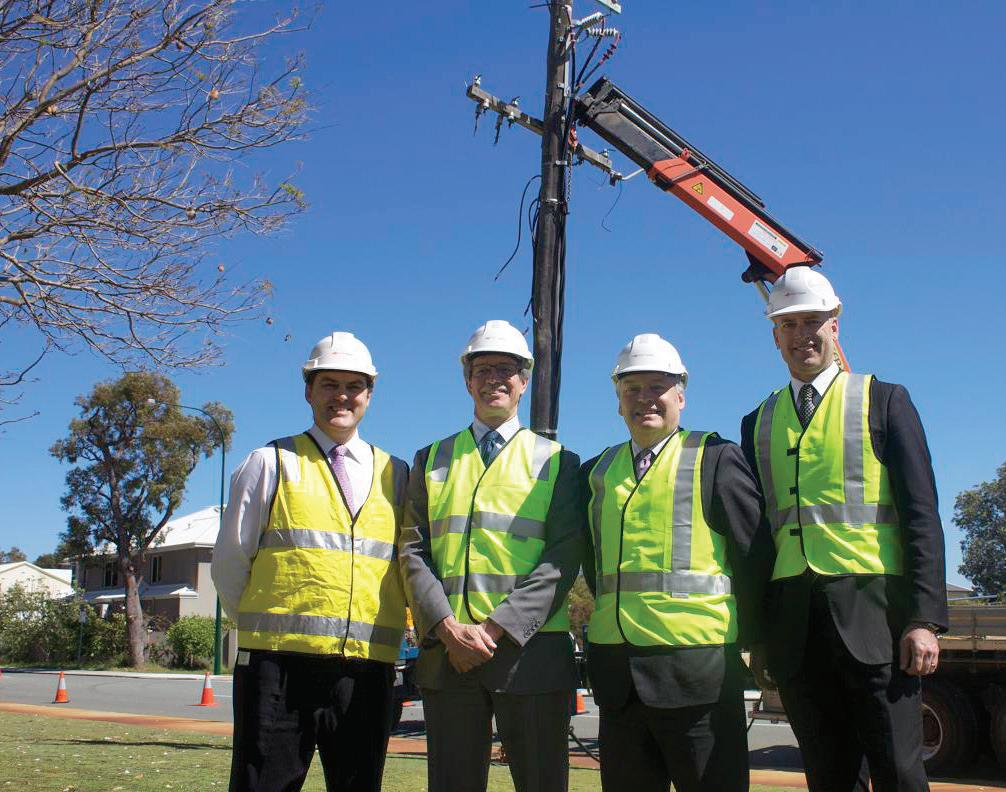
for street light installation and removal of wires and wooden poles; and various small pneumatic borers for installing services inside properties to the meter positions.
CONTRACT MANAGEMENT
The project has also been very successful in keeping to budget. Once a project is selected by the State Government it is then managed by Western Power, who oversee the planning, design, engineering, construction, completion and handover of the new asset to the company’s assets division.
Western Power uses design contractors for the planning, civil contractors for the construction work, electrical contractors for the connections into each property, and electrical demolition contractors to remove the old overhead system and install interfaces to the overhead system in adjacent streets.

They also manage the engineering and all of their contractors are on head contract arrangements for the duration of a Round of the Program, usually around 3 to 4 years. Tenders for the head contracts are called before each Round and are based on a lower schedule of rates for the work than normal market rates. Because the Councils and in turn the ratepayers are contributing up to 50% of the cost of each project, Western Power ensures contracting arrangements are secure so they can keep within the project budget. In return for working at agreed rates, they provide the contractors with continuous work for that Round. These arrangements have worked extremely well over the last 6 to 8 years and generally have retained the same contractors. It is worth noting that the last project where budget was exceeded was in early 2003 and Western Power has since completed 43 projects (including 24 major residential projects) within budget. The projects currently in construction are all progressing under budget as well.
44 UTILITY • FEBRUARY 2014 WWW.UTILITYMAGAZINE.COM.AU
PAUL ITALIANO, CEO WESTERN POWER; MIKE NAHAN, THE MINISTER FOR ENERGY; RUSSELL AUBREY, MAYOR OF THE CITY OF MELVILLE; AND DEAN NALDER, THE MEMBER FOR ALFRED COVE.
ELECTRICITY
Power goes underground in the west

COMPLETED PROJECTS
THE FOLLOWING MAJOR RESIDENTIAL PROJECTS HAVE BEEN COMPLETED UNDER THE SUPP.
PILOT PROJECTS
1
ROUND 2
ROUND 3
ALBANY COTTESLOE BICTON VICTORIA PARK SOUTH
APPLECROSS PEPPERMINT GROVE EAST FREMANTLE SHENTON PARK
COTTESLOE/ CLAREMONT DALKEITH/ SWANBOURNE RIVERVALE GOSNELLS NORTH
WEMBLEY
WOODLANDS SOUTH PERTH CITY BEACH
COMO
CLAREMONT PORT HEDLAND
ROSSMOYNE MT PLEASANT/ BOORAGOON FREMANTLE
EAST FREMANTLE/ PLYMPTON MT LAWLEY NEDLANDS EAST
WEST LEEDERVILLE/ NORTH
WEMBLEY HIGHGATE
EAST VICTORIA PARK/CARLISLE WEMBLEY DOWNS
SUBIACO COMO EAST
WEST NEDLANDS
NORTH MOSMAN PARK
THE FOLLOWING LOCALISED ENHANCEMENT PROJECTS HAVE BEEN COMPLETED UNDER THE SUPP.
ROUND 1
ROUND 2
ROUND 3
ROUND 4
WARREN ROAD, NANNUP JARRAHDALE ROAD, JARRAHDALE OCEAN DRIVE, BUNBURY TOODYAY
STEWARD STREET, DOWERIN ALBANY HIGHWAY, GOSNELLS LOWOOD AND LANGTON ROADS, MT BARKER
SOUTH WESTERN HIGHWAY, DONNYBROOK
HEATON ST, JURIEN BAY
DENHAM ROAD, DENHAM MAIN STREET, BALINGUP BRUNSWICK JUNCTION
STEER STREET, COLLIE ROCKINGHAM BEACH PRECINCT
BUSSELL HIGHWAY, MARGARET RIVER
BROCKMAN STREET, NANNUP ALBANY HWY, VICTORIA PARK
GEORGE STREET, PINJARRA STUBBS STREET, LAKE GRACE COWARAMUP
MORETON TERRACE, DONGARA MUNDARING TOWNSHIP, MUNDARING
GIBLETT AND BROCKMAN STREETS MANJIMUP
MARY STREET, HIGHGATE FORESHORE GERALDTON
UDUC ROAD, HARVEY
SCARBOROUGH BEACH PRECINCT
HAMPTON STREET, BRIDGETOWN
WWW.UTILITYMAGAZINE.COM.AU UTILITY • FEBRUARY 2014 SECTION 45
ROUND
ELECTRICITY

THE FUTURE GRID FORUM PANELLISTS (L-R): JOHN BRADLEY (ENERGY NETWORKS ASSOCIATION), PHIL CRAIG (ORIGIN ENERGY), CHARLES POPPLE (GRIDAUSTRALIA), ANNA SKARBEK (CLIMATEWORKS AUSTRALIA), TONY JONES (JOURNALIST AND PANEL HOST), PAUL GRAHAM (CSIRO), CASSANDRA GOLDIE (AUSTRALIAN COUNCIL OF SOCIAL SERVICE), MATT MCKENZIE (GE).
UTILITY • FEBRUARY 2014 WWW.UTILITYMAGAZINE.COM.AU 46 SMART GRID
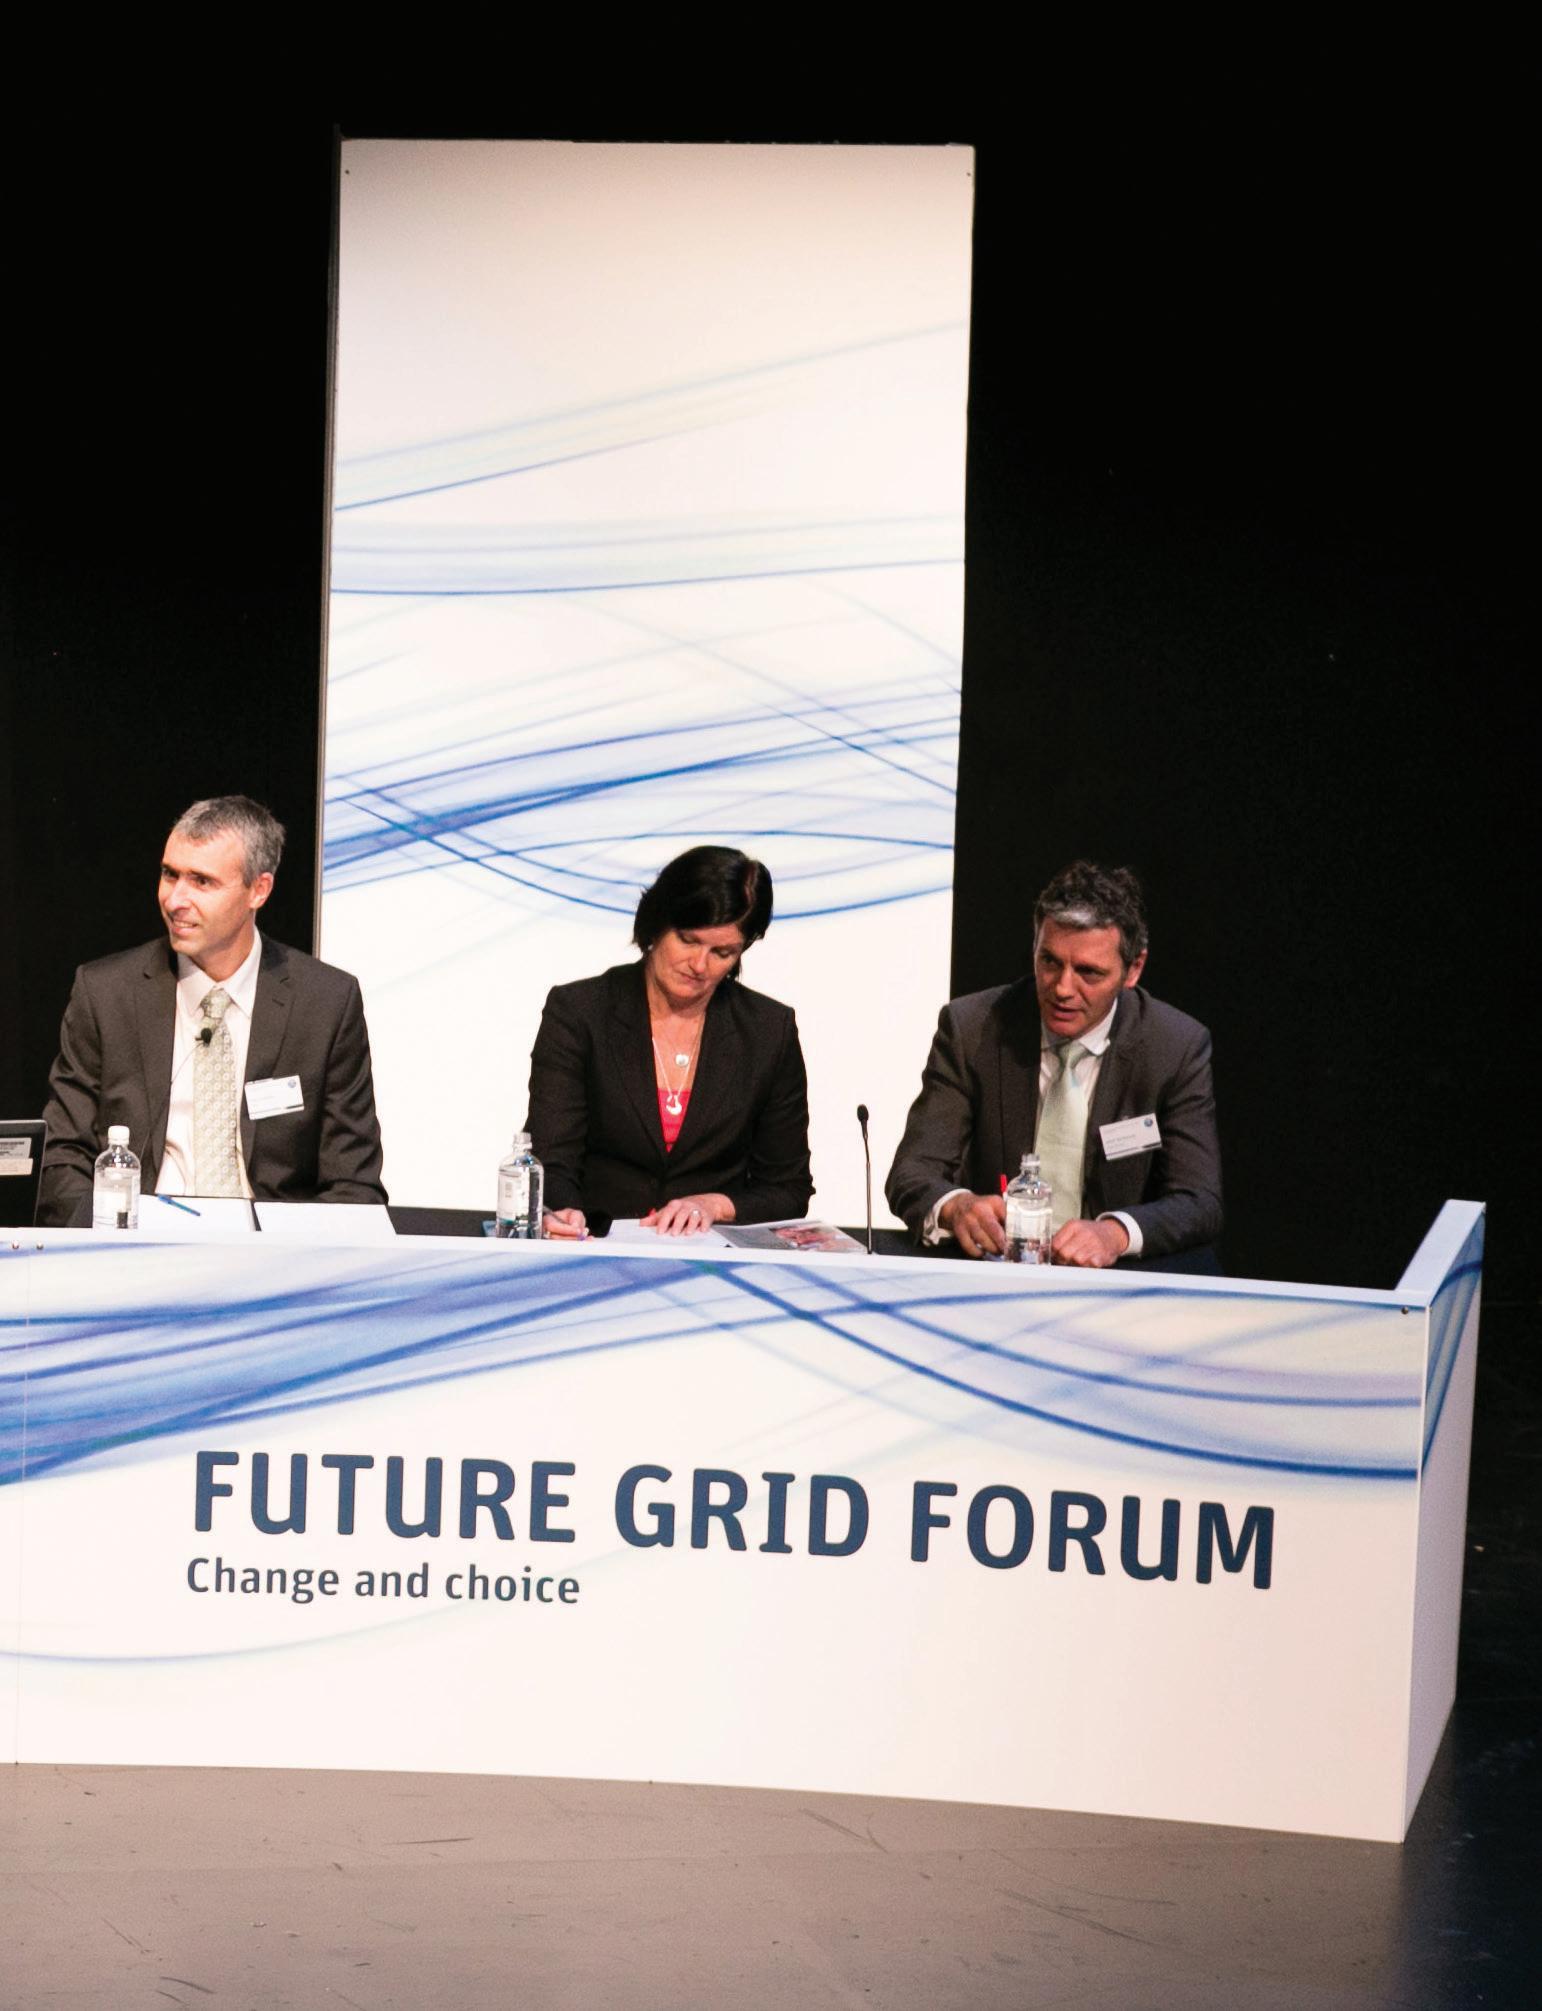
Historically high retail electricity prices, widespread deployment of solar panels, and declining aggregate peak demand and consumption in most states have changed projections of how the electricity sector may develop in the future. To take a fresh look at the possibilities and their implications, the Future Grid Forum has been working for 18 months to develop plausible alternative scenarios, review their associated risks and challenges and determine the options for responding.
The Future Grid Forum was convened and facilitated by CSIRO, commencing in August 2012. The project brought together 120 representatives from across industry, government and community groups. The process emphasised the need to analyse the system as a whole, rather than just in individual parts. The projects final report is titled Change and Choice: The Future Grid Forum’s analysis of Australia’s potential electricity pathways to 2050
In developing the scenarios the Forum chose to explore “megashifts” – events that fundamentally change the electricity business model either suddenly or incrementally over time. The main sources of megashifts were proposed to be low cost electricity storage, sustained low demand for centrally-supplied electricity, and the need for significant greenhouse gas abatement.
Consumer choices were also considered as a key catalyst for change and may include adoption of potential new business models, openness to alternative tariff arrangements, and a higher overall level of engagement by consumers with their electricity use.
WWW.UTILITYMAGAZINE.COM.AU UTILITY • FEBRUARY 2014 SECTION 47 SMART GRID
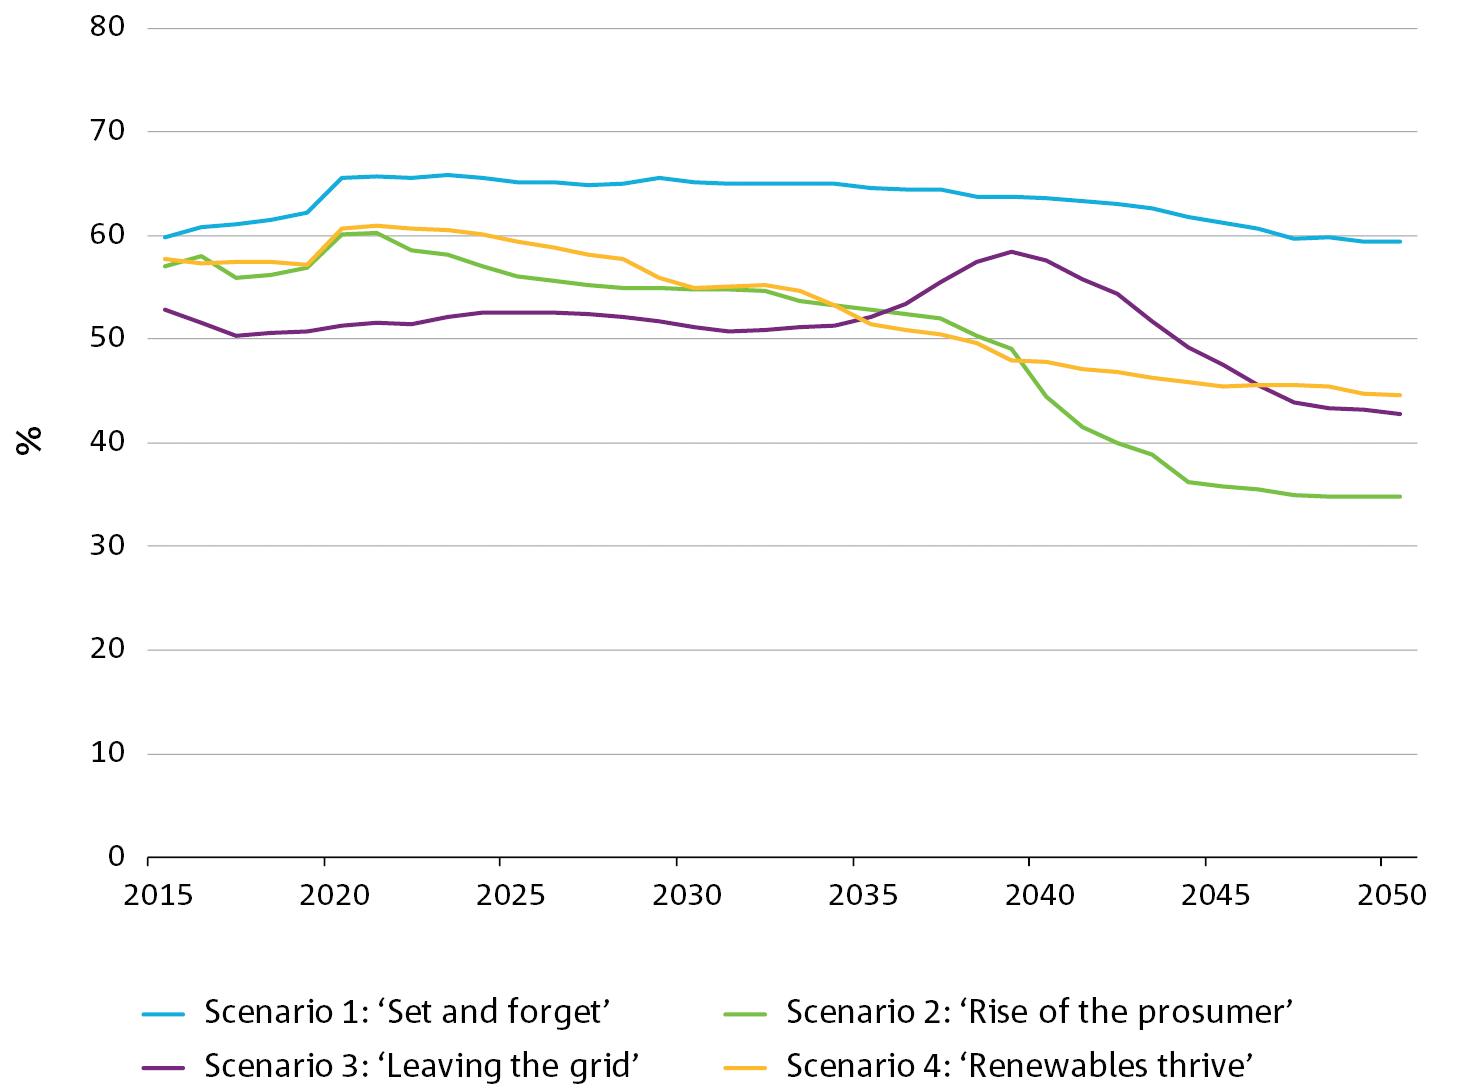
Using these building blocks, the Forum arrived at four possible scenarios.
SET AND FORGET
Sustained high retail prices, heightened awareness about the issue of peak demand, and new business and technology opportunities lead residential, commercial and industrial customers to adopt peak demand management. The demand management systems are managed centrally and designed to be on a ‘set and forget’ basis after customers have decided which level of demand management suits them.
RISE OF THE PROSUMER
Continued falling costs of solar rooftop panels and other on-site generation technologies, sustained high retail prices, and increasingly innovative
UTILITY • FEBRUARY 2014 WWW.UTILITYMAGAZINE.COM.AU 48 Future Grid Forum releases Change
and Choice
Distribution System WWW.CSIRO.AU/FUTURE-GRID-FORUM THE FUTURE GRID FORUM ELECTRICITY IN 2050 Rise of the Prosumer Scenario Scenario Snapshot The level of investment and running costs required to realise this scenario by 2050 $950 BILLION COST RENEWABLES Share of renewable electricity generation 2013 2050 CHANGES TO BILLS 2013 2050 46% 27% By 2050, a tide of consumers take up on-site generation and electric vehicles. The role of centralised power and liquid fuels declines considerably. Customer-centric model where customers consume, trade, generate and store electricity. WHAT IS A PROSUMER A consumer who becomes involved with designing or customising products for their own needs – this can include electricity. Moving away from a one-way relationship, the network becomes a platform for transactions. Service providers compete to integrate and facilitate these transactions. Customers choose their level of control from a wide variety of plans. 2.5% 2.9% $1771 $2793 Annual residential electricity bills Share of income spent on residential electricity bills SERVICE PROVIDERS & NETWORK Service Provider: Price has reached high set point - curtail air conditioner 25%? Customer: Yes CONSUMERS SIGN UP TO VOLUNTARY DEMAND CONTROL SCHEMES Appliances can be automated to adjust their power use when certain conditions are met. This could be determined by a price point or a time of system stress depending on how the scheme is set up. Consumers do not play an active role in demand control but rely on utilities for the solutions to integrate and operate the schemes. Energy Sources WWW.CSIRO.AU/FUTURE-GRID-FORUM THE FUTURE GRID FORUM CENTRAL CONTROL 19% 81% By 2050, a niche of consumers take up onsite generation (19%) and electric vehicles (also 19%), but most rely on centralised power and liquid fuelled transport. ELECTRICITY IN 2050 Set & Forget Scenario Scenario Snapshot The level of investment and running costs required to realise this scenario by 2050 $855 BILLION COST RENEWABLES Share of renewable electricity generation 2013 2050 CHANGES TO BILLS 2013 2050 2.5% 2.4% $1771 $2308 Annual residential electricity bills Share of income spent on residential electricity bills Central Control: Air conditioner will be switched to 23 C for 10mins. FIGURE 1: PROJECTED NETWORK UTILISATION UNDER THE FUTURE GRID FORUM SCENARIOS SMART GRID
financing and product packaging from energy services companies leads to the widespread adoption of on-site generation with almost half of generation on-site. Residential consumers in particular are empowered by their choice to become more actively engaged in their electricity supply and call themselves ’prosumers’.
LEAVING THE GRID
The continued dominance of volume-based pricing among residential and small commercial consumers encourages energy efficiency without accompanying reductions in peak demand growth. The subsequent declining network utilisation feeds increases in retail prices. New energy service companies sensing a market opportunity invite consumers to leave the grid, offering an initially higher-cost
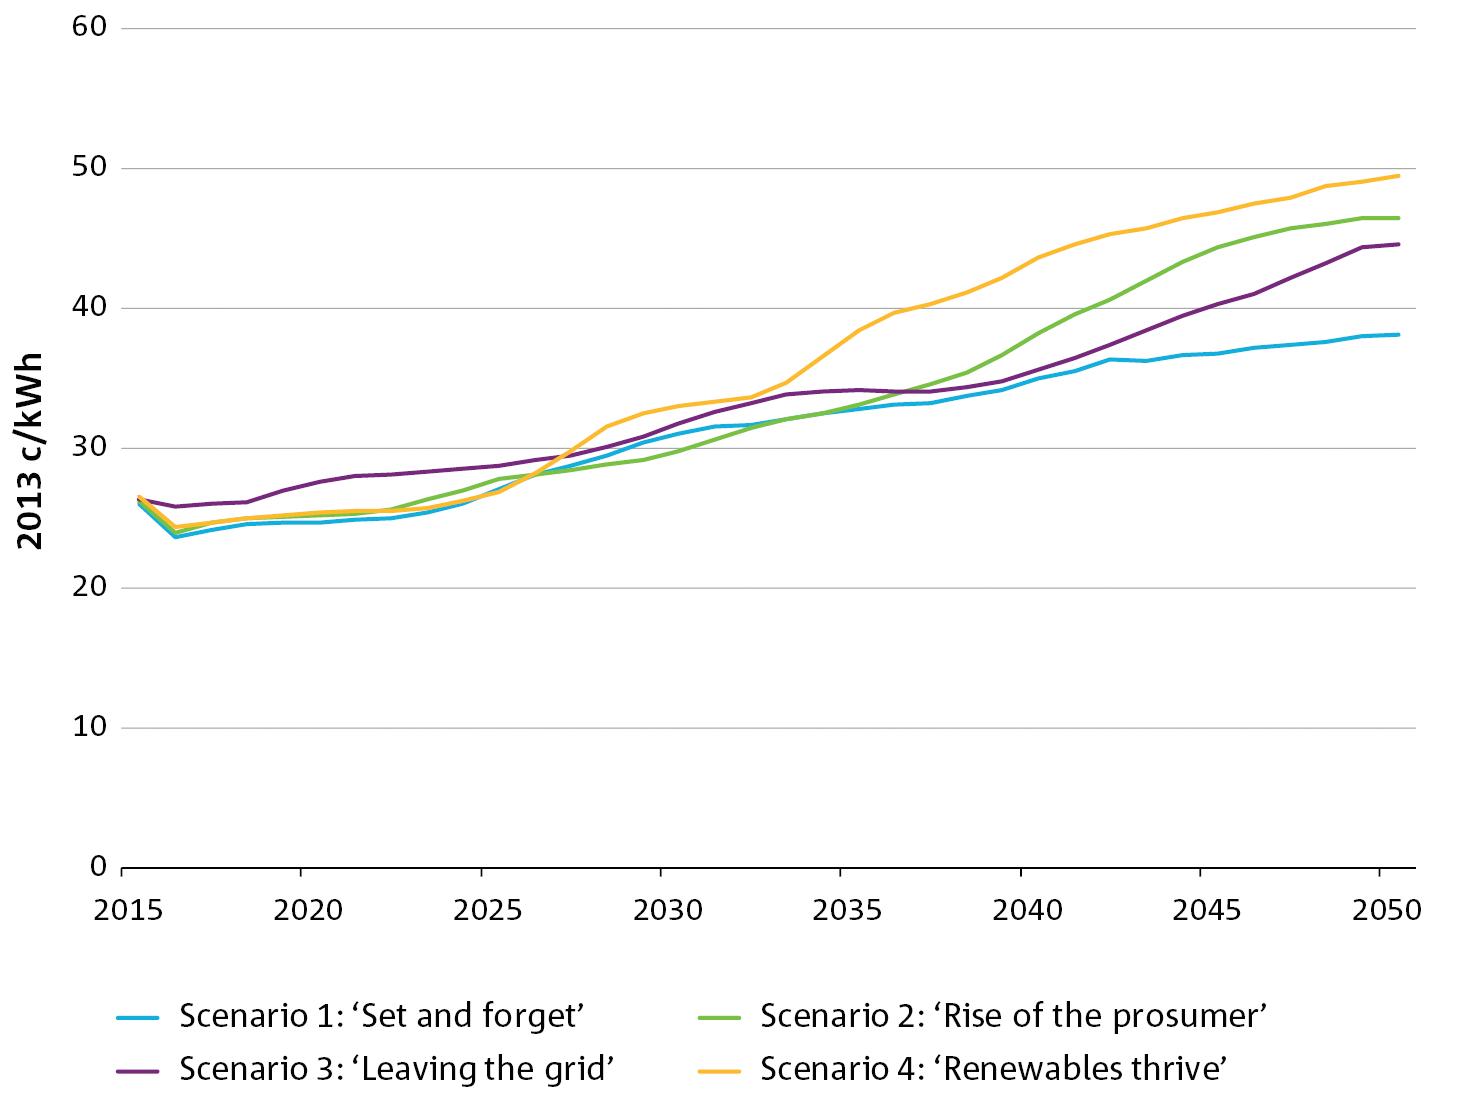
WWW.UTILITYMAGAZINE.COM.AU UTILITY • FEBRUARY 2014 SECTION 49 Future Grid Forum releases Change and Choice
Battery Costs WWW.CSIRO.AU/FUTURE-GRID-FORUM THE FUTURE GRID FORUM ELECTRICITY IN 2050 Leaving the Grid Scenario Scenario Snapshot The level of investment and running costs required to realise this scenario by 2050 $1042 BILLION COST RENEWABLES Share of renewable electricity generation 2013 2050 2.5% 2.3% CHANGES TO BILLS $1771 $2213 Annual residential electricity bills Share of income spent on residential electricity bills 2013 2050 AROUND A THIRD OF CONSUMERS COMPLETELY DISCONNECT FROM THE GRID Using a combination of gas generation, solar panels, storage and energy efficiency. Disconnecting from the grid as a residential consumer is projected to be economically viable from around 2030 – 2040 as battery costs fall. 35-40 c/kWh 2030 – 2040 costs of disconnecting from the grid 110 c/kWh 2013 costs of disconnecting from the grid 32% 68% 2013 2040 STORAGE PLAYS A LARGE ROLE IN ALL ASPECTS OF THE ELECTRICITY SYSTEM. Storage supports a 100% share of renewables in centralised power supply by 2050, high electric vehicle uptake (37% by 2050) and strong demand control. Storage WWW.CSIRO.AU/FUTURE-GRID-FORUM THE FUTURE GRID FORUM ELECTRICITY IN 2050 Renewables Thrive Scenario Scenario Snapshot The level of investment and running costs required to realise this scenario by 2050 $936 BILLION COST RENEWABLES Share of renewable electricity generation some fossil generation remains in decentralised supply 2013 2050* CHANGES TO BILLS 2013 2050 2.5% 2.6% $1771 $2502 Annual residential electricity bills Share of income spent on residential electricity bills CENTRAL CONTROL Batteries are used widely in houses, cars and at large scale at power stations. Battery storage smoothes out the intermittency of renewable-generated energy and helps to level the profile of peak electricity demand. SMOOTHED PROFILE CURRENT PROFILE FIGURE 2: PROJECTED FUTURE CHANGES IN RETAIL UNIT COSTS SMART GRID
Future Grid Forum releases Change and Choice
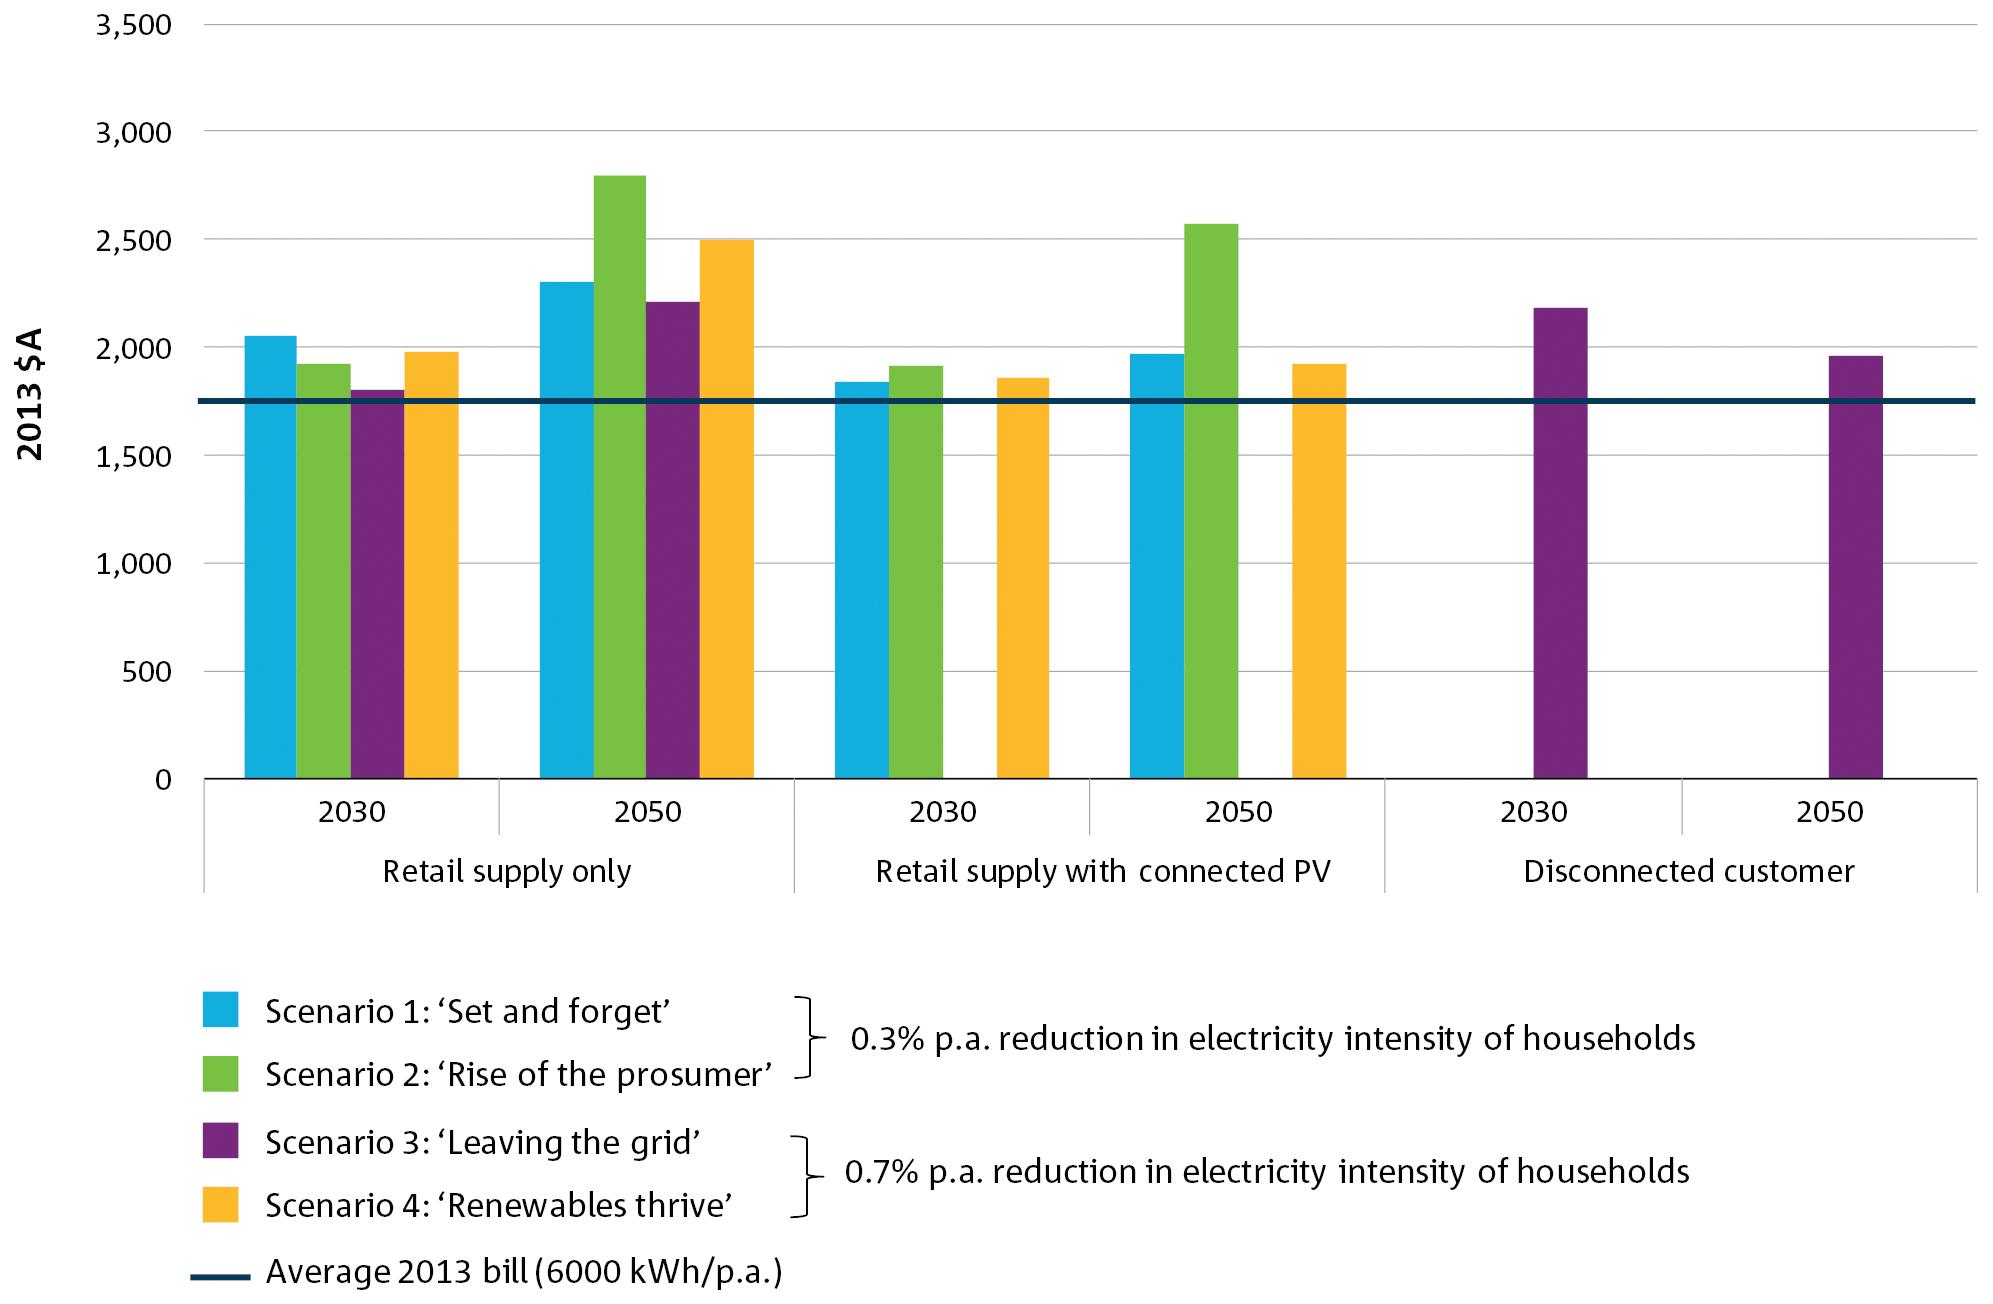
solution, but one that appeals to a sense of independence from the grid. By the late 2030s, with reduced storage costs, disconnection becomes a mainstream option with a third of consumption eventually being removed from the grid.
RENEWABLES THRIVE
Confidence in the improving costs of renewable and storage technologies, achieved by combined efforts from government and industry around the world, results in the introduction of a linearly phased 100 per cent renewable target by 2050 for centralised electricity generation. Some customers maintain fossil based on-site power so that overall, the renewable share, taken as a share of both centralised and on-site generation, is 86 per cent by 2050.
The Future Grid Forum recognised
that in reality the future will likely incorporate combinations of these scenarios and also be impacted by other factors not considered. However, these scenarios were useful to be able to explore some specific challenges.
NETWORK UTILISATION
Falling network utilisation will be a major challenge to containing further increases in electricity unit costs. Figure 1 shows how network utilisation changes over time in each of the scenarios.
In Set and forget, Rise of the Prosumer and Renewables thrive, distribution network utilisation initially improves because peak demand growth is being limited while consumption is growing (underlying consumption growth is consistent with AEMO’s 2013 projections). However, from the 2020s, the utilisation rate begins to decline as a result of the uptake of
on-site generation, which decreases the amount of consumption that needs to be supplied by the grid.
The incidence of declining network utilisation begins earliest and the rate is strongest in Rise of the Prosumer and Renewables Thrive because they have stronger uptake of on-site generation.
Leaving the grid does not include any peak demand reduction measures and this is the major reason for the projected lower utilisation from 2015 through to 2035. After 2035, when customer disconnection is at its strongest, the loss of these customers temporarily improves utilisation because those leaving the grid tend to be smaller residential and commercial consumers who have a higher contribution to peak demand. However, as the level of disconnection stabilises, the declining trend reasserts itself.
UTILITY • FEBRUARY 2014 WWW.UTILITYMAGAZINE.COM.AU 50
SMART GRID
FIGURE 3: PROJECTED FUTURE CHANGES IN ELECTRICITY BILLS
NBN: THE STATE OF PLAY
By Michelle Goldsmith
The National Broadband Network is the largest and most ambitious infrastructure project currently being undertaken in Australia. In a digital age, the NBN will eventually impact upon the lives of most Australians. However, much is still uncertain about the project and the information can be difficult to find and obscured by speculation. In this article, we seek to decode the facts and uncertainties regarding the NBN and provide an overview of the various parties and technologies involved in its construction.
CHANGE OF GOVERNMENT
The change from a Labor to a Coalition Government in September, 2013 threw the future of the NBN into uncertainty due to significant differences in the two political parties’ strategies for the rollout.
While the Labor Government planned to utilise fibre-to-the-premises technology for the NBN, the Coalition Government has stated that to reduce the project’s costs it intends to use primarily fibre-to-the-node (FTTN) technologies, except in newly developed areas or those in which fibre-to-the-premises (FTTP) construction has already progressed too far to make reverting to copper a viable option.
With the change in Government came a number of major revisions to the NBN Co. board and the commission of a strategic review to determine the NBN rollout strategy.
There have also been a number of recent delays to the rollout, changes in contractors and personnel, in addition to allegations of various parties failing to fulfill their contractual obligations.
After the release of the results of the Strategic Review, an expert panel was appointed to conduct an independent cost-benefit analysis of broadband and review of the regulatory arrangements that will govern the NBN.
STRATEGIC REVIEW
When the Coalition Government took power in 2013 it issued an Interim Statement of Expectations to NBN Co. to govern its actions in the period following the change of leadership pending alterations to the company’s board, a strategic review of the project and the drafting of a new corporate plan.
A third party Strategic Review of NBN Co. was announced to help the

new Government determine how to proceed with the project, the best infrastructure mix to use and to formulate an updated plan for completing the rollout in the fastest and least costly manner.
The advisory firms contracted to contribute their services to the Strategic Review were Deloitte, KordaMentha and Boston Consulting Group.
Deloitte was contracted to provide governance and program management office services to ensure the Strategic Review fits within the parameters and tight deadline for submission set by the Government.
KordaMentha was contracted to contribute to the analysis of the current NBN operational and financial performance.
Boston Consulting Group was chosen to participate in the review of the timing, financials and product
WWW.UTILITYMAGAZINE.COM.AU UTILITY • FEBRUARY 2014 51 NBN
NBN: the state of play
offers under alternative models of delivering very fast broadband.
THE FINDINGS:
The results of the review suggested that the rollout could be completed sooner and at a lower cost using a mixed technology approach involving fibre-to-the-node technology, the existing copper infrastructure and cable connections. While this will not result in download speeds as fast as a FTTP rollout, it will still provide faster download speeds than are currently available.
This multi-technology rollout, which aligns with current Government policy, is estimated to cost $41 billion rather than the $29.5 billion estimated in April. This estimate allows for an increase in the project’s contingency reserve from 10 to 20 per cent.
The report also stated that the Government’s aim of ensuring nationwide access to fast broadband by 2016 cannot be achieved.
Key findings of the Review regarding a rollout using a mix of technologies suggested:
• That such a plan, including upgrading existing HFC infrastructure and deploying both fibre to the premise and fibre to the node, will reduce funding by $32 billion assuming Government equity is capped at $29.5 billion.
• The reduced costs compared to a FTTP NBN may mean retail broadband prices need not rise.
• About 91 per cent of premises in the fixed-line footprint will have access to download rates of at least 50 megabits per second by 2019.
• Under plausible assumptions about revenues, an NBN using an optimised mix of technologies can earn returns roughly equal to the Government bond rate.
WHAT IS STILL IN QUESTION?
• Infrastructure – the infrastructure mix that will be used, including the amount of FTTP and/or FTTN connections used, has still not been finalised. The Strategic Review suggests around 26% FTTP, 44% FTTN and 30% hybrid fibre-coaxial (cable) connections.
• Finances - How much the construction of the NBN will cost overall is still uncertain. The latest figures for the Coalitions mixed technology rollout are estimated at approximately $41 billion.
• Completion date – The Coalition Government’s deadline to provide nationwide access to the NBN by 2016 was found to be unachievable. The eventual timeframe for completion is still uncertain and will likely depend on the final corporate and infrastructure policies decided upon for the project.
• Longevity – Depending on the technology chosen for the rollout, there is speculation as to whether the network will have the capacity to stand up to future growth in data usage and whether further upgrades will be necessary.
• Regulation – The rules and regulations that will decide the retail prices that service providers are allowed to charge for connection to the NBN and the level of market competition have not yet been finalised. However, the Government received regulatory approval from the Australian Competition and Consumer Commission on changes to the regulatory document, the Special Access Undertaking, in December 2013. In the same month, after the release of the Strategic Review, the Government appointed a panel of
experts to perform a cost-benefit analysis and review of the regulatory arrangements of the NBN.
THE NBN CO.
The personnel of the NBN Co. underwent significant changes with the change of government.
WHO IS OUT?
After the change of Government, all but one former board member of NBN Co. offered their resignations to new Minister for Communications, Malcolm Turnbull.
These included former Chief Executive Mr Michael Quigley, Chairwoman Siobhan McKenna, Chief Operating Officer Ralph Steffens and Head of Network Operations Leisel Ramjoo. Brad Orgill, the one board member who refused to voluntarily resign, was dismissed.
The position of Head of Quality was also made redundant causing Mr Mike Kaiser to leave the company.
WHO IS IN?
While accepting the resignations of the other previous board members, the Coalition Government requested that Dr Kerry Schott and Miss Alison Lansley continue serving on the board.
In October 2013, Communications Minister Malcolm Turnbull announced that former Telstra executive, Dr Ziggy Switkowski had been appointed as the new Executive Chair of NBN Co.
Soon after Ziggy Switkowski was announced as Chair, the position of Head of Strategy and Transformation was created and Mr JB Rousselot was appointed to the role. This new position was created to incorporate the activities previously undertaken within the Quality group, the corporate planning, strategy and decision support functions of the office of the Chief Finance Officer and lead the Strategic Review of the NBN.
UTILITY • FEBRUARY 2014 WWW.UTILITYMAGAZINE.COM.AU
52
NBN
In November 2013, another former Telstra executive Mr Greg Adcock was appointed to the position of Chief Operating Officer (COO).
Later in the same month, three new non-executive directors were appointed to the board; Mr Justin Milne, Mr Patrick Flannigan and Mr Simon Hackett.
In December 2013, Vodafone CEO Bill Morrow was announced as the new CEO of NBN Co.
THE NBN ROLLOUT Contractors
The NBN Co. awarded contracts for the various works involved in the design and construction of the National Broadband Network to a number of companies.
The primary contractors responsible for the rollout in each state are as follows:
Silcar:
Silcar Pty Ltd is the tier one contractor for the NBN rollout throughout the ACT, New South Wales and Queensland. Previously a joint venture between Siemens and Thiess, in 2013 Siemens’ shares were acquired by Thiess. Thiess is a subsidiary of Leighton Holdings, who also owns NBN contractor Visionstream.
Before going into caretaker mode before the 2013 election, the NBN Co. renewed its construction contract with Silcar for another 12 months.
Transfield:
Transfield Services was awarded the initial contract for the construction of the NBN in Victoria.
In 2013 NBN Co. also extended its contracts with Transfield, valued at approximately $300 million, for a further two years. Under the contract Transfield will provide design and construction services for the local and distribution network that runs from a fibre access node (FAN) through each street in a coverage area.
NBN Co has also awarded Transfield another contract worth up to $66 million to complete the installation of

the individual fibre link from the street to the connection box on the exterior of each premises in the rollout area as well as a $170 million contract comprising Passive Fibre Network design and construction and Build Drops (house pre-connections) in metropolitan Sydney and south east Sydney.
Visionstream:
Visionstream, a subsidiary of Leighton Holdings, was awarded the primary contract for the rollout in Tasmania as well as additional works in Victoria, Queensland and southern New South Wales. The contract was valued up to $334 million over two years, with two one-year options to renew, and adds to the existing NBN construction efforts of Silcar in NSW and Queensland and Transfield in Victoria. Recently, the Coalition Government called into question the Visionstream’s progress on the project in Tasmania but the company denied all allegations that it had ceased construction.
SA Power Networks:
Following the decision in 2013 not to renew the existing construction contract with Syntheo for the rollout in South and Western Australia, SA Power Networks became the major contract holder for South Australian rollout and Downer EDI became the primary contractor in Western Australia
Downer EDI:
Downer had already been contracted by NBN Co to roll out the network in Northern New South Wales and has further contracts to connect multi dwelling units such as blocks of flats and office blocks to the NBN
in Victoria and NSW (“MDUs”) and to connect the fibre from the street to individual premises in northern NSW (“build drops”). Downer was also awarded an additional two-year contract to roll out fibre optic broadband in an area covering approximately 300,000 premises in Brisbane and Melbourne.
Changes in contractors:
Syntheo:
Syntheo is a 50/50 joint venture between Lend Lease and Service Stream. The company was initially awarded the primary contracts for the NBN rollout in Western Australia, South Australia and the Northern Territory.
In March 2013, Syntheo handed back ownership of a large part of the NBN rollout in the Northern Territory to NBN Co. after delays in construction. The company’s contracts for WA, SA and the NT have not been renewed and a replacement contractor for the majority of the NT works has not yet been selected. In the meantime, Lend Lease will control the delivery of Syntheo’s remaining obligations under the agreement with NBN Co, subject to the satisfaction of approval conditions. Service Stream’s obligations for additional contracts it directly entered into with NBN Co to deliver the NBN, primarily to new developments in NSW, WA, SA and the NT, and for Field Services Delivery and Network Augmentation and Restoration Activities in Victoria, WA, SA and NT are still in effect.
WWW.UTILITYMAGAZINE.COM.AU UTILITY • FEBRUARY 2014
53
NBN: the state of play
NBN
SA QLD VIC WA
In South Australia a total of 7,120 premises had been passed with 4,291 activated and able to connect.
In Queensland a total of 89,450 premises had been passed with 25,551 activated and able to connect.
Rollout figures as of the 1st of January 2014
A total of 397,063 premises had been passed by the National Broadband Network across Australia. Of these, 126,251 were able to connect to the network immediately.
FTTP and FTTN: what is the difference? SA Power Networks
Fibre-to-the-Premises (FTTP)
In Victoria a total of 92,403 premises had been passed with 27,887 activated and able to connect.
In Western Australia a total of 27,106 premises had been passed with 8,848 activated and able to connect.
Using the fibre-to-the-premises model, each premise would be directly connected to the network via optic fibre.
Speed: up to 1000 megabits per second.
Original estimated cost: $37.4 billion
Original delivery date: 2021
Revised final cost: $73 billion
Revised delivery date: 2024
Fibre-to-the-Node
(FTTN) mixed technology rollout
Using fibre-to-the-node technology the fibre optic network terminates at a self-contained node servicing each area.
Speed: up to 100 megabits per second.
Original estimated cost: $22 billion
Original delivery date: first stage by 2016 and the second by 2019
Revised final cost: $41 billion
Revised delivery date: unknown
54 UTILITY • FEBRUARY 2014 WWW.UTILITYMAGAZINE.COM.AU Major contractor: Downer EDI Major contractor: Transfield Services. Contract extended in 2013 for a further two years. Additional works: Visionstream, Downer EDI Major contractor: Silcar Pty Ltd. Contract renewed in 2013 for a further 12 months. Additional works: Visionstream, Downer EDI Major contractor: SA Power Networks
NATIONAL BROADBAND NETWORK
most
to
be
on
Disclaimer:
Updates: The
up
date rollout metrics and weekly updates can
viewed
the NBN Co. website: http://www.nbnco.com.au/about-us/weekly-progress-report.html
Every care taken to ensure that information included in this article was correct and up to date when written. Nevertheless, due to the nature of the project changes may occur.
Silcar Downer EDI Transfield
NT NSW TAS ACT
The primary contractor for the NT rollout was Syntheo. However, the company’s contracts have not been renewed and ownership of the rollout will revert back to NBN Co. A replacement contractor is yet to be selected.
Major contractor: Silcar Pty Ltd. Contract renewed in 2013 for a further 12 months.
Additional works: Transfield, Downer EDI
In New South Wales a total of 115,233 premises had been passed with 38,012 activated and able to connect.
In the Northern Territory a total of 6,966 premises had been passed with 1,412 activated and able to connect.


Major contractor: Visionstream
In Tasmania a total of 43,253 premises had been passed with 12,676 activated and able to connect.
Major contractor: Silcar Pty Ltd. Contract renewed in 2013 for a further 12 months).
In the Australian Capital Territory a total of 15,532 premises had been passed with 7,574 activated and able to connect.
Who is in?
The personnel of the NBN Co. underwent significant changes with the change of government.

New non-executive directors;
Executive Chair
Dr Ziggy Switkowski
CEO Mr Bill Morrow
Chief Operating Officer (COO)
Mr Greg Adcock
Head of Strategy and Transformation
Mr JB Rousselot
Mr Justin Milne
Mr Patrick Flannigan
Mr Simon Hackett.
Continuing board members;
Dr Kerry Schott
Miss Alison Lansley


SECTION NATIONAL BROADBAND NETWORK 55 WWW.UTILITYMAGAZINE.COM.AU UTILITY • FEBRUARY 2014
?
Silcar Visionstream Silcar
SERVICING THE MERNDA AND DOREEN GROWTH AREA
By

56 UTILITY • FEBRUARY 2014 WWW.UTILITYMAGAZINE.COM.AU
Paul Patrick, Yarra Valley Water
SEWER
Fast growing urban areas present a challenge for water utilities. Often located on the city fringe, they can be remote from existing infrastructure. Yarra Valley Water outlines the future planning they undertake to ensure they keep up with this growth.
BACKGROUND
The existing townships of Mernda and Doreen are located approximately 30 kilometres northeast of the Melbourne CBD. Currently the area contains approximately 8,000 properties and is expected to reach an ultimate figure of approximately 22,000 properties by 2040.
The area was identified for development in the late 1990’s and construction commenced on the first sub-divisional development in the early 2000’s.
Following the identification of the area for development, Yarra Valley Water (YVW) commenced planning
works for the provision of sewerage services to the area. The initial servicing investigation identified the following issues for YVW in providing initial and long term sewerage services to the area.
• The area was remote from the existing sewerage system, with the nearest sewers located approximately 8kms away in the two neighbouring catchments of Eltham/Lower Plenty and Darebin Creek North.
• The Eltham/Lower Plenty and Darebin Creek North catchments did not have sufficient capacity to accommodate the

ultimate flows from Mernda/ Doreen, which would require that flows be attenuated in the Mernda/Doreen catchment during wet weather events.
• Of the two adjacent catchments, the Eltham/Lower Plenty catchment had the greatest available spare capacity, estimated to be in the order of 425L/s of available capacity in the Eltham Main Sewer.
SECTION 57 WWW.UTILITYMAGAZINE.COM.AU UTILITY • FEBRUARY 2014
SEWER
Servicing the Mernda and Doreen growth area
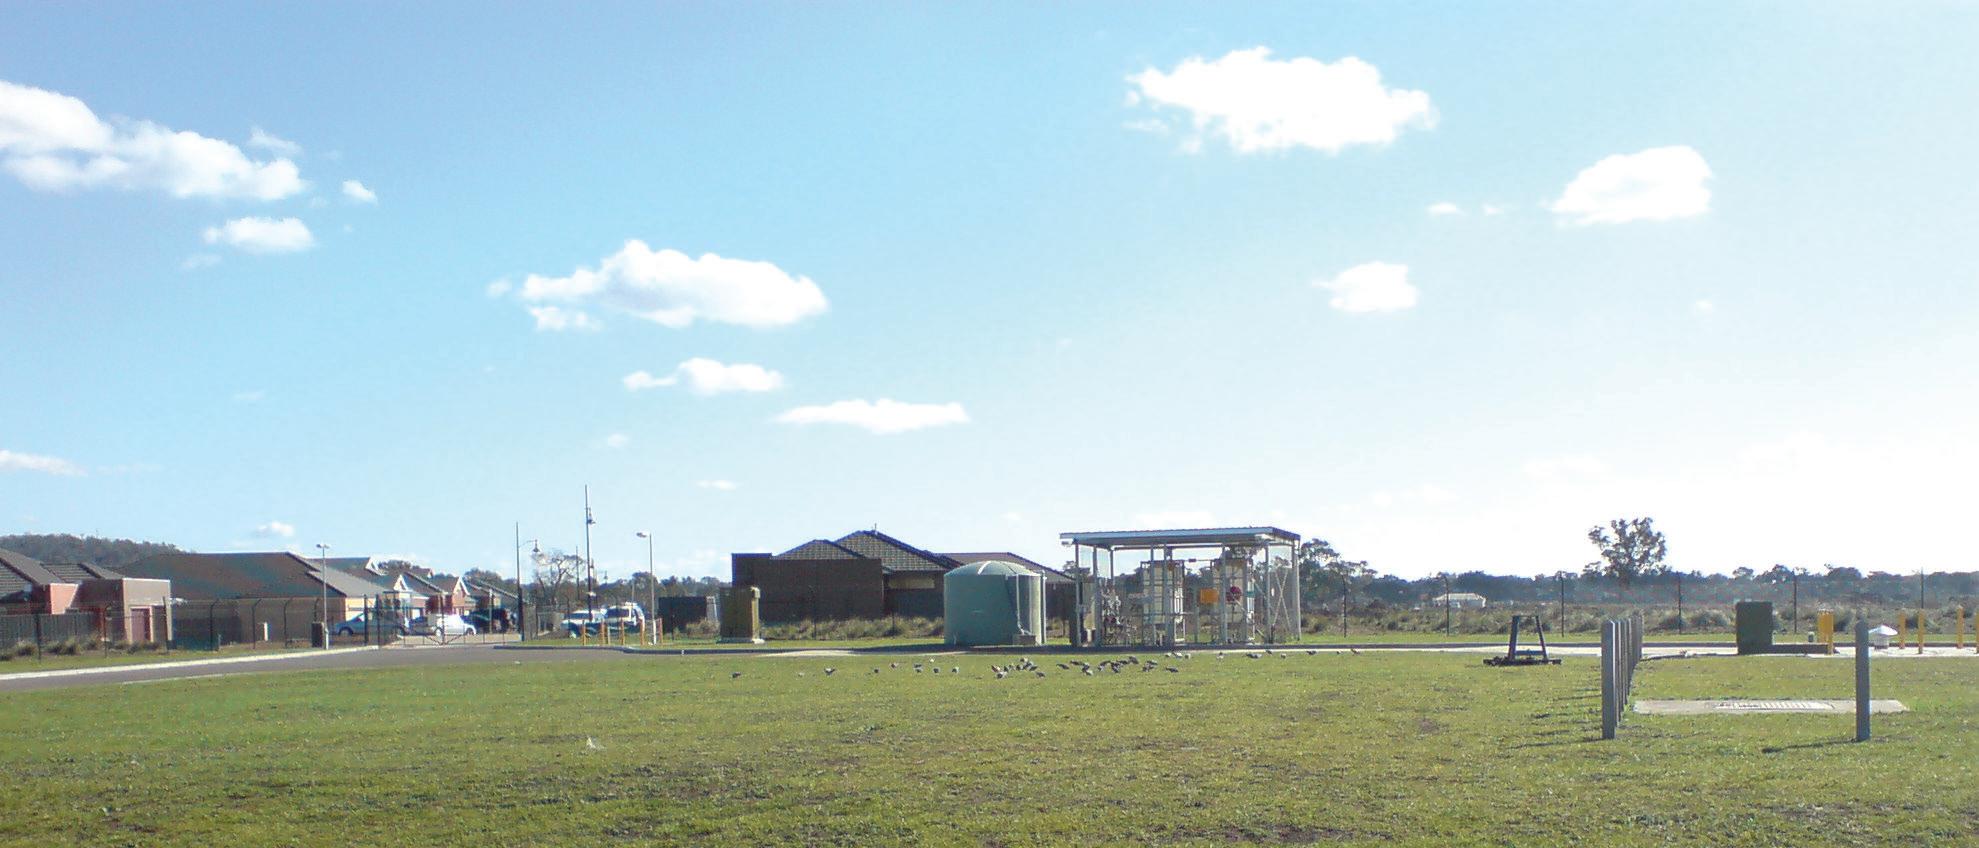
To service the initial developments, the Painted Hills Sewage Pump Station (SPS) and associated 13km DN250 transfer main was commissioned in 2001 to transfer flows into the Eltham Main Sewer.
The Painted Hills SPS solely serviced development in the area up to 2008, when the following assets were commissioned.
• Mernda South Sewage Pump Station (SPS) and Flow Control Facility (SFC)
• Mernda North Sewage Pump Station and Flow Control Facility
• Doreen Sewage Pump Station and Flow Control Facility
The current day-to-day operation of the system is complex, with interlocks in place to control the operation of all the pump stations and flow control facilities. As development has increased, the operation of the system is becoming more difficult, and issues are becoming evident.
ISSUES
The issues that were identified arising in the system with the increase in growth were:
• The transfer system has limited capacity, inhibiting the ability to transfer flows out of the catchment.
• The limited transfer system capacity has resulted in the
flow control facilities operating during some peak dry weather events, and increased times to pump down the system following wet weather events
• The complex interlock system between the pumps and flow control facilities is restricting operational flexibility in peak flow events
A hydraulic assessment was undertaken on the system utilising a calibrated InfoWorks CS model to determine the cause of these issues and identify potential solutions. Following is a brief outline of the assessment and outcome of the of each of the issues.
TRANSFER SYSTEM
The original transfer system comprised of the Painted Hills SPS and DN250 transfer main, which was upgraded in 2008 to include connection of the Doreen SPS. Upon connection of the Doreen SPS, the operation of Painted Hills SPS and Doreen SPS was interlocked.
The transfer main comprises of a rising section and a falling section of pressure main, and the hydraulic assessment determined that its transfer capacity was impacted by two factors, being:
• The falling section of the pressure main had a maximum
capacity of approximately 80L/s
• The interlock between the Doreen and Painted Hills pump stations resulted in periods where neither pump operated, whilst the pumps changed over Ultimately, the solution would be to upgrade the transfer system to increase its capacity via the construction of a larger transfer main. To facilitate this would require significant capital expenditure, not available in the current Water Plan, so a short term solution was required to increase the transfer capacity.
The short-term solution identified was to remove the interlock between the Doreen and Painted Hills pump stations and to divert flows from Painted Hills SPS into the Doreen SPS catchment. Doreen SPS is the larger of the two pump stations with a capacity of 85L/s, and removal of the interlock would remove the no flow issue during pump change over.
Assessment of the sewerage network identified the diversion of flows from Painted Hills SPS into the Doreen SPS catchment would be relatively simple and require the construction of a short section of DN225 sewer.
In addition to these works, it was also found that during dry weather periods it would be beneficial if flows from Mernda North SPS and/
UTILITY • FEBRUARY 2014 WWW.UTILITYMAGAZINE.COM.AU 58
SEWER
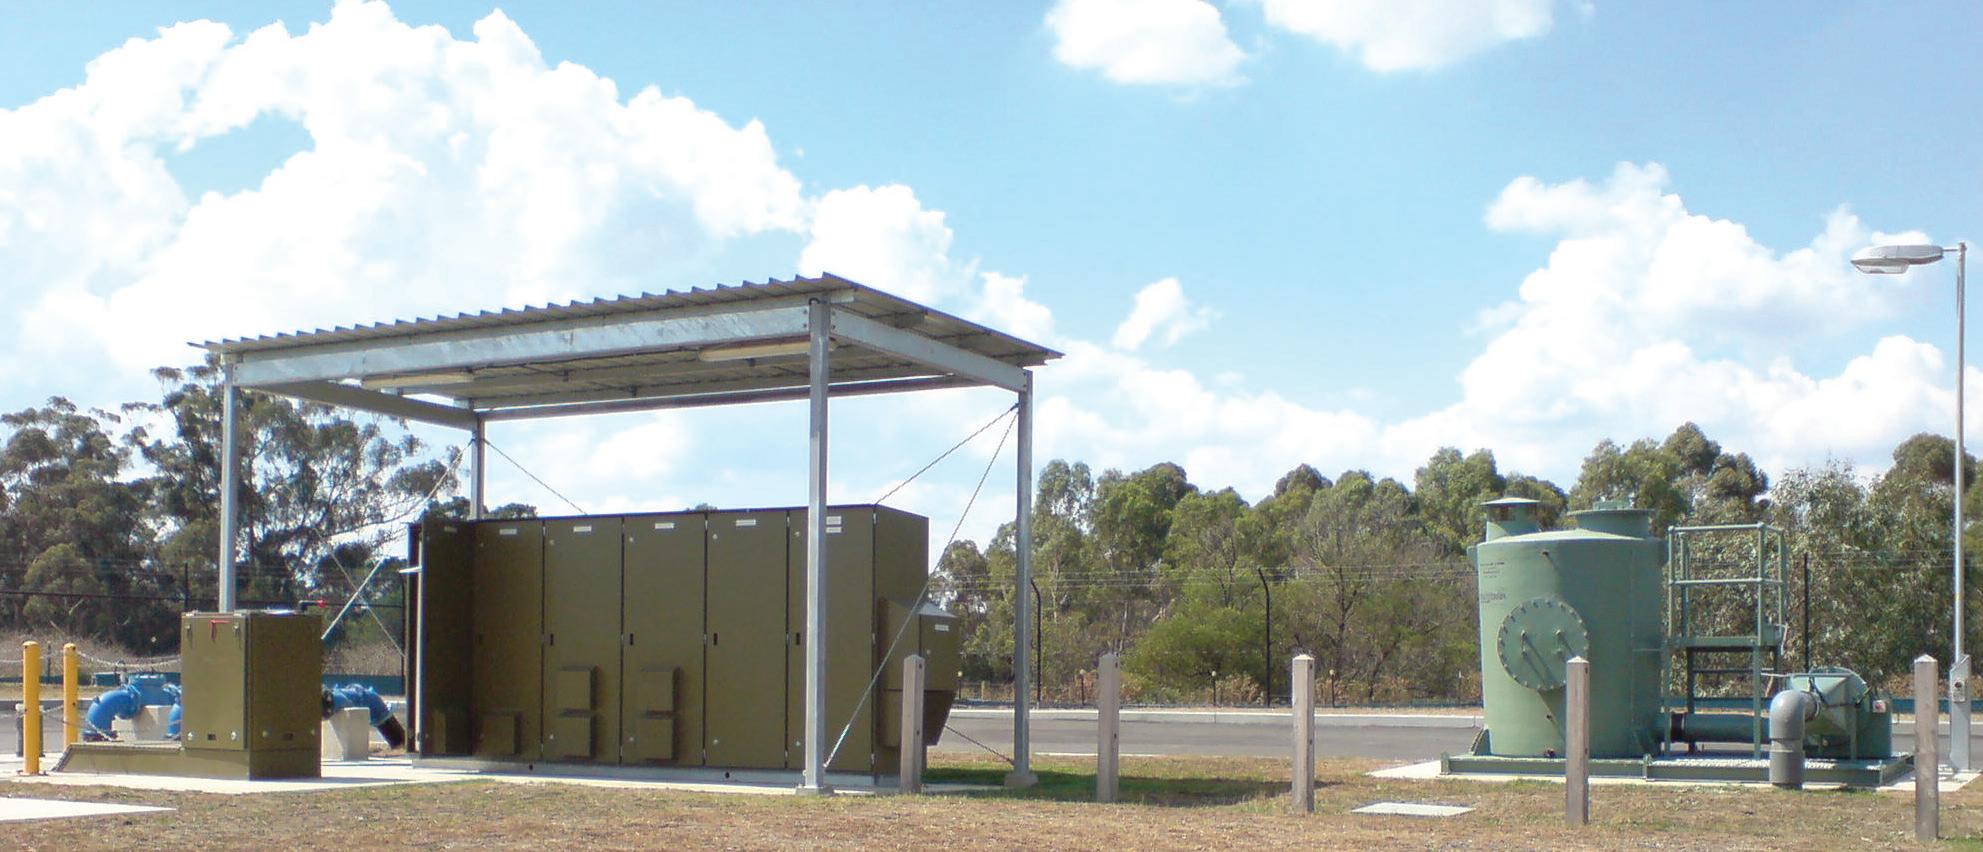
or Mernda South SPS to Doreen SPS could be reduced.
Assessment of the system determined that reducing flows could be achieved by either increasing the capacity of the flow control facilities at both Mernda North and Mernda South, or transferring flows to an adjacent catchment.
The preferred solution identified was to transfer dry weather flows from Mernda South SPS into the adjacent Darebin Creek North sewer catchment. Growth within the Darebin Creek North catchment has resulted in the sewerage network expanding to within a few kilometres of the Mernda/Doreen catchment. Transfer of flows from Mernda South to the Darebin Creek North catchment can therefore be achieved via the construction of a 3km link main.
Installing this dry weather diversion would reduce the volume of flow being sent to the Doreen SPS and modelling indicated this would result in the flow control facilities no longer operating during peak dry weather periods.
INTERLOCKS
The current interlock system is complex with multiple interlocks existing between the pump stations and flow control facilities. The interlocks serve two main functions, being:
• Interlocking pumps to inhibit concurrent operation
• Interlocking the flow control facilities to maintain each facility within a set volume of each other.
The hydraulic modelling determined that as flows had increased, these interlocks were limiting the flexibility of the system, and it would be ideal if the number of interlocks could be reduced.
These improvements had the net effect of removing the interlocks that Doreen SPS had with Painted Hills SPS and Mernda South SPS.
Modelling indicated that with Doreen SPS no longer being interlocked with Painted Hills SPS and having unrestricted access to the transfer main, combined with Mernda South transferring dry weather flows to an adjacent catchment, the requirement to maintain the flow control facilities within a set volume of each other was no longer necessary. This allowed the interlock between Mernda North SPS and Doreen SPS to be removed.
FUTURE GROWTH
As the Mernda and Doreen areas continue to grow, significant upgrade works will be required, and current modelling of the system indicates that by 2040:
• Painted Hills SPS will have doubled its current hydraulic capacity and have a flow control facility.
• Doreen SPS will have five times its current hydraulic capacity.
• Mernda North SPS and SFC will have an increased hydraulic capacity and have tripled their flow control facility capacity.
• Mernda South SFC will have tripled its flow control capacity.
CONCLUSION
The servicing of the Mernda and Doreen areas highlights the ongoing problem Water Authorities encounter when providing sewerage services to the ever expanding growth areas. The existing sewerage system is often remote from the development area and/or not sized to accommodate the proposed growth. The servicing of the initial development is problematic due to low flow rates, which often require construction of temporary assets or staging of asset construction.
Often complex solutions are needed to service new developments in the short to medium term, often at a significant cost to the Water Authority.
WWW.UTILITYMAGAZINE.COM.AU UTILITY • FEBRUARY 2014 SECTION 59
Servicing the Mernda and Doreen growth area
SEWER
LESSONS LEARNED ON A FIRST MICROTUNNEL
Utilities are making increasing use of trenchless technologies to install or upgrade their infrastructure, taking advantage of the opportunity to minimise disruptions such as closed roads, resulting in big savings in time and money for the local community. Wide Bay Water Corporation (WBWC) has extensive experience with directional drilling, but recently undertook their first microtunnelling project.

The project required a new 450mm gravity trunk sewer to be constructed along a busy section of roadway through the Pialba business district of Hervey Bay. Traffic on the road was as high as 7,000 vehicles per day. The route was also very close to a parallel 300 AC water main, 150mm below a 4 x 1200 RCP drainage culvert and for a short distance, 5.5 metres below the road surface level. There were also numerous other service crossings to be negotiated.
According to WBWC, “the extensive disruption to local business that would have occurred by open trenching the work, even as night work, justified consideration of using trenchless technologies. Needing to accurately maintain the design 1 in 714 grade of the sewer over reach lengths of 140 metres then became the defining requirement for the use of microtunnelling over other trenchless technologies.”
The project presented some significant challenges, not least the need to design around the many constraints of an older area of the business district. At one point of the sewer, in natural swale behind the beach dune, the sewer invert is above the existing ground level. This area of the work had to be filled and stormwater drainage provided above and below the sewer transecting a large stormwater chamber. The stormwater, earthworks and one of the drill launch sites were in close proximity to heritage listed fig
UTILITY • FEBRUARY 2014 WWW.UTILITYMAGAZINE.COM.AU 60
SEWER

ABOUT WIDE BAY WATER
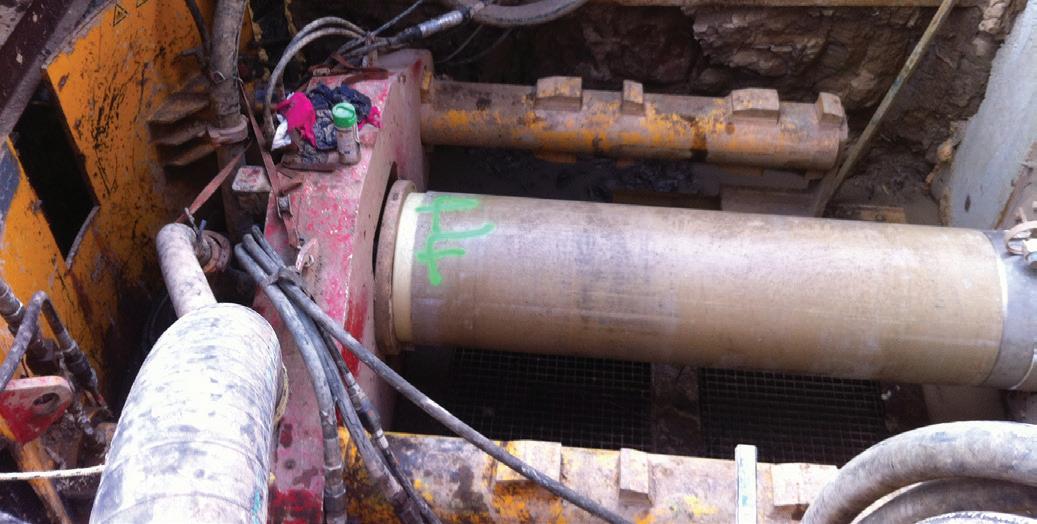
Wide Bay Water Corporation is based in Hervey Bay and Maryborough, about 250 km north of Brisbane.
Wide Bay Water Corporation is wholly owned by the Fraser Coast Regional Council. Their core business is to provide water and wastewater services to the Fraser Coast. Their staff motto is “Whatever you do, do it well”. More than 200 people, across a broad skills base, work with this ethic in mind in an environment that encourages and rewards excellence.
WBWC has an onsite laboratory, a dedicated environmental services team, a strong commitment to workplace health and safety, an in-house engineering team and an award-winning reuse scheme that includes the irrigation of more than 500 hectares of hardwood tree plantations.
trees and minimising impact on these trees was a major consideration. Maintaining day time traffic flow around the retrieval pit in the parking lane of a busy street required sheeting of the excavation with steel plates. A significant amount of night work was also required to minimise the impact on local business.
The contract for the works was awarded to Bothar Boring & Tunnelling, who started setting up site at the beginning of August, using a Herrenknecht AVN 400. Bothar was chosen through a public tender process and WBWC explained that the combination of micro tunnelling and civil works required for the project resulted in tender submissions from both civil and drilling contractors. Bothar was chosen after evaluation of both price and their extensive experience in microtunnelling that was the most critical performance requirement for the success of the project.
As with all projects various difficulties were encountered along the way. The loss of drilling mud into piped stormwater drains and from there into open drains was a concern. The loss was not discovered for some hours until it became evident in open drains some 400 metres from the drill site. While the spill was contained and environmental damage avoided, the clean-up was expensive and public perception of the drilling operation tainted.
The soft wet clay, through which much of the drilling operation was conducted, was not conducive to accurately
achieving the design grades. A level non-compliance of 45mm occurred over the longest reach of 140 metres. While this was able to be countered in the next reach, as constructed grades varied between 1 in 500 and 1 in 1300 compared to the design 1 in 714. There was also a localised sag approaching 10mm deep in one reach of the completed pipe. Once the pipes are in place there is nothing that can be done to correct these non-compliances. The constructed sewer was capable of performing the design intent and was accepted. WBWC noted that any future micro tunnelling contracts they prepared will have clearly defined construction tolerances specifically applicable to drilled and jacked pipe and financial penalties for measurable non-compliance.
Now complete, the new sewer trunk has solved a number of problems for WBWC. Urban intensification in the catchment of the existing 300mm trunk sewer had started to over load the sewer and downstream pump station. The new 450 sewer short-circuited the pump station and was able to achieve gravity flow direct to the receiving 900mm gravity sewer approximately one kilometre downstream from the pump station. The success of the project avoided the need to upgrade of the existing 300 trunk sewer previously laid through commercial properties within the central business district and the augmentation of the pump station which would otherwise have been necessary to cater for the increased flows.
WWW.UTILITYMAGAZINE.COM.AU UTILITY • FEBRUARY 2014 SECTION 61
SEWER
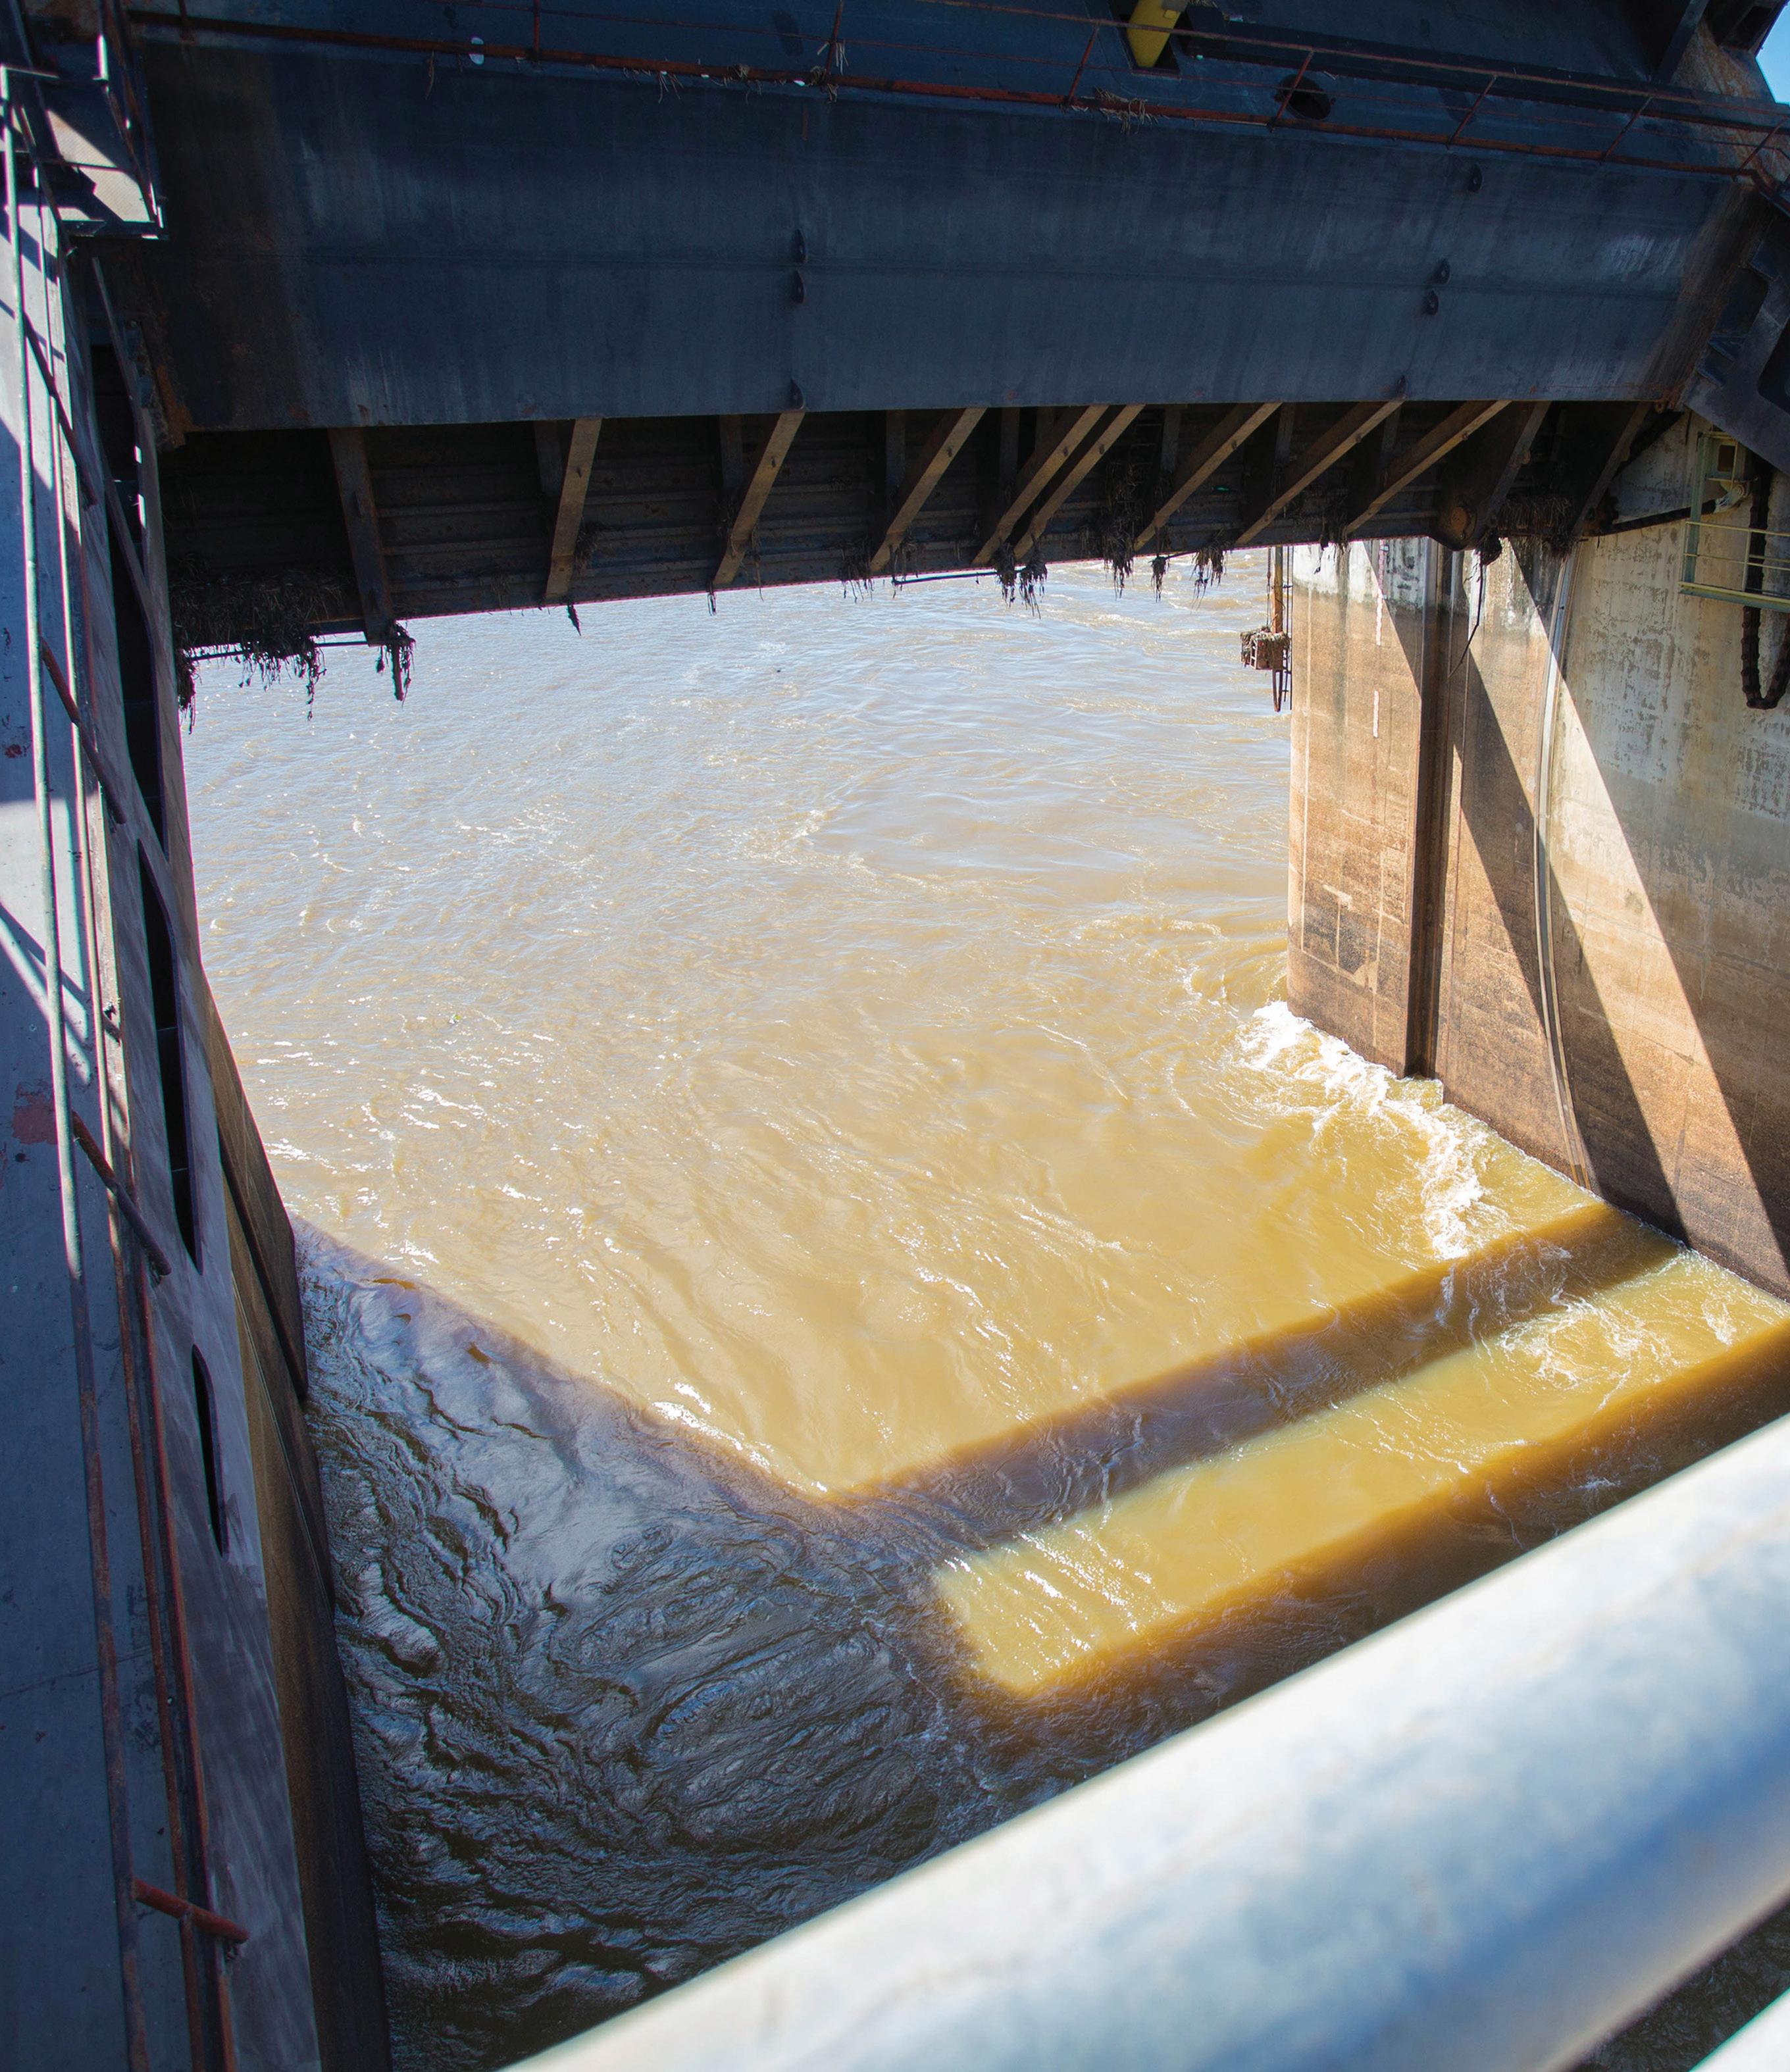
TO DAM OR NOT TO DAM
UTILITY • FEBRUARY 2014 WWW.UTILITYMAGAZINE.COM.AU 62 WATER/DAMS

Over the long term, dams can provide the cheapest source of bulk water for the urban environment, and dam water is easier to treat than other sources, such as seawater desalination. However, their construction can involve significant costs, and environmental impacts. The Water Services Association of Australia (WSAA) has prepared a detailed study into dams.
Surface water dams have long dominated Australia’s urban water system. The first two – Yan Yean outside Melbourne and Lake Parramatta, Sydney – were completed in 1857. Dam building continued steadily, accelerating after WWII. Today, there are 500 large (more than 15m high) dams. The Sydney Catchment Authority has 20 supply dams and weirs that hold more water per head of population than any other city in the world. Other metropolitan areas such as Melbourne and South East Queensland (SEQ) store dam water providing for up to seven years of secure supply based on historical inflows.
Dams smooth out seasonal, annual and multi-year drought variations in inflow, to distribute water supply according to daily demands. The capacity of dams to sustain supply is dictated by local site conditions and stream flow conditions that are affected by climate and weather. This leads to the characterisation of dams as a ‘climate-dependent water source’.
Dams generally provide the cheapest source of bulk water for the urban environment. They are typically gravity-fed and are easier to treat than other sources, such as seawater desalination. For a long time dams have met demand for water. Occasional imbalances have been managed by temporary water restrictions. However, the role of dams in public water supply and flood mitigation has been brought under the ‘political’ microscope by the long term drying trend in the south of Western Australia, by the Millennium Drought (1997-2009), and by the record floods on the east coast/southeast of Australia (2010/11).
In rural and regional Australia dams have played a big part in building rural and regional prosperity. Many towns around
WWW.UTILITYMAGAZINE.COM.AU UTILITY • FEBRUARY 2014 SECTION 63 WATER/DAMS
To dam or not to dam
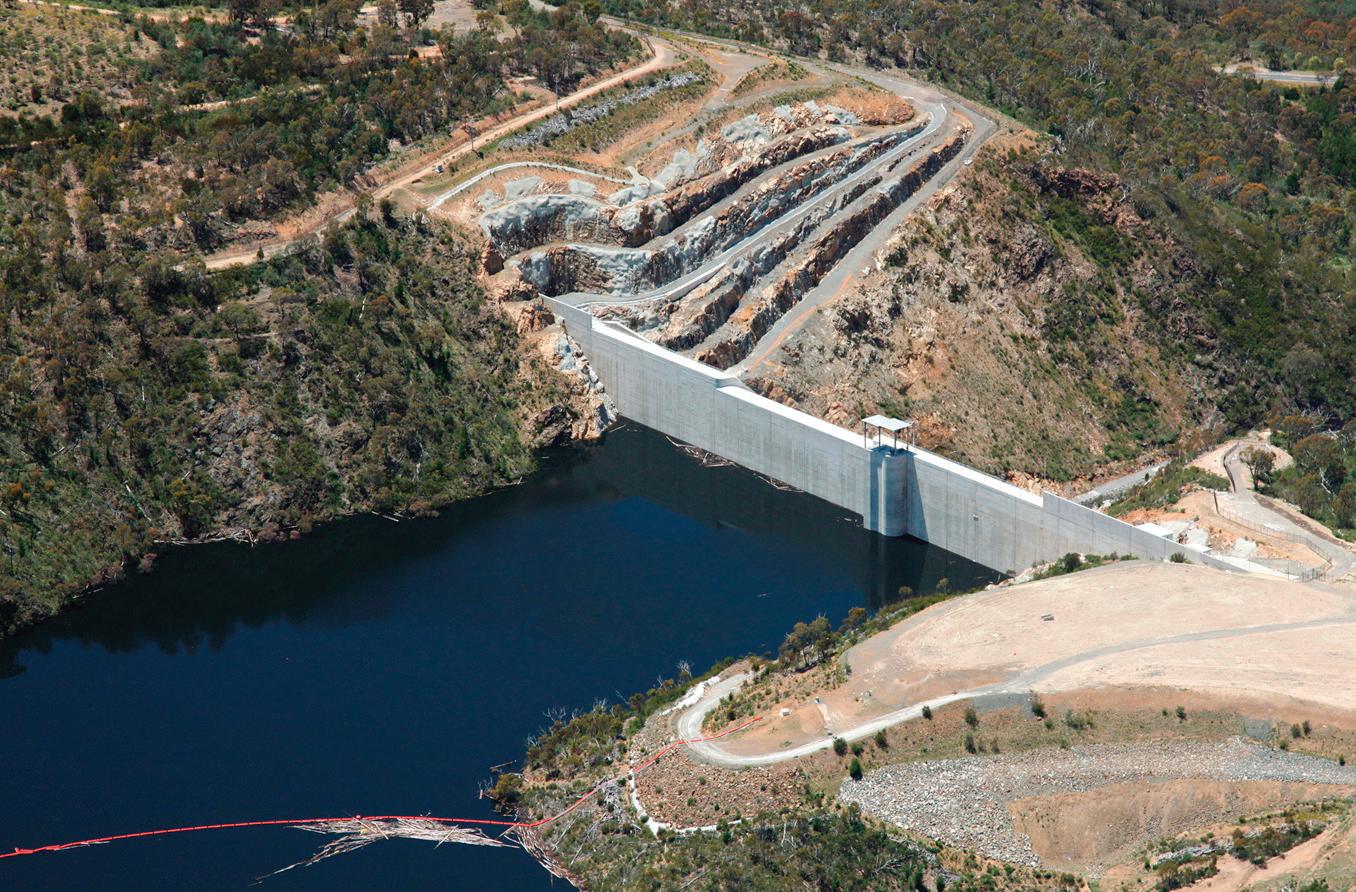
Australia are dependent on dams for their water supplies. The building and management of dams has reflected how regularly Australia suffers from droughts and floods. However, this is now being challenged by changing climate conditions and some of the surrounding uncertainties, particularly the severity and timing of extreme weather events.
CLIMATE RISK – NOT ENOUGH RAIN
The water supply risk includes early projections of up to 10% less rainfall across southern Australia by 2030 and 20% by 2050. They also include more extreme events including drought, floods and bushfires (CSIRO & BOM 2007, 2011). This is crucial for public water supply in Australia’s most populous areas.
The south west of Australia has experienced a step change in its rainfall and stream flow patterns. The long-term drying trend evident from
the mid-1970s currently places this area and the city of Perth in a position where it is unlikely that any new dams will ever be built.
In Victoria during the Millennium Drought, stream flow reductions into dams were four times greater than the decline in rainfall (CSIRO 2010). This occurred not only because of a general decline in annual rainfall, but because reductions in autumn changes meant catchments were drier at the start of winter, resulting in less efficient winter runoff from catchment areas. This highlights the complex relationship between climate, weather, rainfall and stream flow into dams. The Millennium Drought reduced national GDP by almost 1% and the net welfare costs of mandatory restrictions (invoked during the drought) amounted to several hundred million dollars per jurisdiction per year (PC 2011).
For further details, please refer to WSAA’s paper ‘Climate Change Adaptation in the Australian Urban Water
CLIMATE RISK – TOO MUCH RAIN
The proportion of total rainfall from heavy falls will increase in the 21st century over many areas of the globe (IPCC, 2012). A 1-in-20 year maximum daily rainfall event is likely to become a 1-in-5 to 1-in-15 year event by the end of the 21st century in many regions (IPCC, 2012). According to the Climate Commission ‘across Australia, it is more likely than not that heavy rainfall events will become more frequent as the temperature increases. The tendency for increase in intensity may be stronger for the larger, rarer events (current 1-in-20 year events) (Rafter and Abbs, 2009) particularly at the sub-daily timescale’ (Westra et al., 2013).
AVERAGE INFLOWS INTO AUSTRALIA’S MAJOR DAMS
Despite record rainfall on the east coast since the Millennium Drought broke, the Climate Commission states
UTILITY • FEBRUARY 2014 WWW.UTILITYMAGAZINE.COM.AU 64
Industry’ (WSAA 2012).
WATER/DAMS
Location
Adelaide 197 (Mount Lofty Ranges dams)
South Australians also rely heavily on the River Murray for public water supply
Brisbane 2,220 (12 dams including Wivenhoe)
Wivenhoe Dam – 1150
Melbourne 1,294 (Upper Yarra, Thomson, Maroondah and O’Shannassy dams)
Mount Lofty Ranges
1892-1990 (177)
1997-2007 (113)
River Murray
1891-2007 (11,100)
1996-2007 (5,700)
Wivenhoe Dam
1984-2001 (572)
2001-2009 (100)
Upper Yarra, Thomson, Maroondah
and O’Shannassy dams
Pre-1996 (615)
1997-2009 (376)
Sydney 2,581 (20 dams including Warragamba and Upper Nepean)
Warragamba and Upper Nepean dams
1909-1948 (951)
1948-1990 (2153)
1991-2012 (673)
Perth 581 (11 dams)
Canberra 205 (4 dams)
that only about one-third of the rainfall debt was paid back with the 2010 and 2011 floods. (Steffen, Hughes & Karoly, 2013).
The above table includes information on total dam capacity in Australia’s major cities and the average inflows into those dams over time. It includes the reduction in inflows experienced during the Millennium Drought on the east coast, and the long-term drying trend in the southwest of Australia (Perth)
DAMS AND FLOOD MITIGATION
Dams provide attenuation on flood flows even when at capacity because of the large surface area, the ability to
1911-1974 (338)
1975-2000 (177)
2001-2005 (93)
2006-2012 (66)
Pre-1996 (202)
1997-2009 (95)
store water, and the constrained rate of outflow through spillways or other release.
At the end of 2010 Queensland had experienced its second wettest year on record experiencing double the mean rainfall. In Victoria the rainfall was 30% higher than average (Steffen, Hughes & Karoly, 2013). The wet season and summer rainfall in 2010/11 for both these states resulted in significant flooding.
However, because of the flood mitigation effects of Wivenhoe Dam, the flood peak in Brisbane in 2011 (4.46m) was fortunately not as high as the record 1974 peak (5.45m).
Nevertheless the impact flooded 14,000 properties, with 1,970 people evacuated (Steffen, Hughes & Karoly, 2013). The Queensland floods also left a damage bill of $2b to local government infrastructure and another $4b to public infrastructure, as well as $2.4b in insurance payouts to date (Insurance Council of Australia 2013).
WIVENHOE DAM – BRISBANE
This was built on the Brisbane River in 1984 to supply water, and provide for flood mitigation. It is able to hold back 1,450 GL above its normal capacity, as a flood mitigation measure. Again, it contributed to reducing the impact of the 2011 floods on Brisbane.
Despite this, the Queensland Government announced a Commission of Inquiry into the management of Wivenhoe during those floods. The final report recommended that dam operators should temporarily reduce the Wivenhoe Dam level to 75 per cent of its normal capacity if the Bureau of Meteorology makes another strong warning about an extremely heavy wet season.
In making this decision the Minister for Water seeks advice in November each year from the Bureau of Meteorology and the Department of Energy and Water Supply. Previous and current seasonal outlooks, current dams levels, water security, and dam operations are considered, to determine the extent to which lowering the dams is likely to mitigate the impacts of a potential flood.
WARRAGAMBA DAM – SYDNEY
Built following a record drought in the 1930s, it is one of the largest domestic water supply dams in the world. Originally the dam had one spillway controlled by gates.
When new flood estimation methodologies indicated that the dam could experience floods much greater than originally anticipated, the dam wall was raised five metres and strengthened
WWW.UTILITYMAGAZINE.COM.AU UTILITY • FEBRUARY 2014 SECTION 65
To dam or not to dam
Total dam capacity (GL)
inflows/yr (GL)
Average
dams
WATER/DAMS
To dam or not to dam
by post tension anchors. The second stage, completed in 2002, involved building an auxiliary spillway for management of floodwaters during rare or extreme conditions (1:750 year events and greater).
The operation of the main spillway gates in 2012 (in response to high rainfall – but not a major flood event) sparked significant interest, as the dam had not spilt for 14 years. In response to the recent spill from Warragamba Dam and the experience in Brisbane, the NSW Government has commenced a detailed review of the flood management arrangements for the Hawkesbury-Nepean Valley.
Options include raising the Warragamba Dam wall to provide some flood mitigation. A flood of the rarity of the 2011 Brisbane floods would leave a significant damage bill. The review will also consider whether the use of alternative operating procedures at Warragamba Dam might assist in mitigating flood impacts downstream. The Government expected to receive findings of the review by the end of 2013.
DAMS AND DRINKING WATER QUALITY
In addition to storing water, dams provide detention times that improve water quality in a number of important respects. This includes natural processes where pathogens die off, and particulate matter settles out. Dams also attenuate fluctuations in water quality, which reduces water quality risks.
Dam storage can also introduce water quality risks associated with cyanobacterial (blue green algae) blooms and the release of iron and manganese from sediments. Manipulating water in the dam and undertaking catchment management activities to reduce nutrient runoff can reduce this risk. Dams are either part of open catchments or closed catchments.
OPEN CATCHMENTS
Open catchments such as those
in SEQ are areas where land use is mixed. While used to harvest water these catchments also include other valuable activities such as farming and recreation. Water from storages in an open catchment undergoes treatment through sophisticated filtration and disinfection systems, given the higher levels of sedimentation and pollutants. Good land management is the first, and best, way to improve the quality of water stored and released from dams.
In open catchments, improving the biodiversity of the catchment and working towards more sustainable land use is the key. In most jurisdictions, this occurs through:
• land use planning and vegetation clearing controls
• devising and using assessment tools for new developments (eg the neutral or beneficial effect test)
• catchment management activities such as tree planting, stream rehabilitation and soil conservation
• community education activities.
CLOSED CATCHMENTS
Closed catchments such as those for most of Melbourne’s supplies do not allow public access.
The native forest filters rainwater that flows across the land and into rivers and creeks that supply the reservoir. As a result, the quality of the water is very high and requires minimal treatment. Closed catchments provide the highest level of protection to drinking water supplies. Melbourne Water for example estimates the water quality benefits of ecosystem services provided by closed catchments is:
• Capital $1.1b
• Operating $110m plus fixed costs, or around $60m/yr
COST OF DAMS
Over the years, dams have provided a relatively cheap supply of water. Approximately $0.30 - $0.90/kL for raw water through to treated dam water;
delivered via a gravity fed system.
The relative difference in costs between dams and seawater desalination ($1.50 - $5/kL) is magnified because most large dams were built, and partially paid for, many years ago. Current water users have been receiving cheap water from the old infrastructure paid for by older generations, but are now paying for the current ‘spike’ in new infrastructure costs. These costs to some extent will equalise over time.
However, for new dams there can be significant costs. Environmental and social impacts associated with their construction add to the financial cost. As this will vary depending on the location and other factors it is difficult to provide an estimate of these financial costs to compare to the financial cost of constructing a seawater desalination plant.
The cost to build a large dam or a seawater desalination plant in today’s dollars is significant. An informed decision must include a good understanding of the factors affecting future demand, like population growth. It must take into account changing development patterns, appliance efficiency and customer behaviour. It must combine these with climate scenario modelling, and environmental flow requirements.
INDUSTRY RESPONSE TO CLIMATE UNCERTAINTY
Dams are major regional infrastructure. This means that existing and potential dams attract many stakeholders, often with competing interests.
Balancing these interests across the environmental, social, economic and cultural values attributed to dams, is complex. The industry is also aware of the need to engage with regional planners and a broad network of stakeholders. The work completed by ACTEW in the lead up to a decision to enlarge Cotter Dam illustrates this. (See following article).
ADAPTIVE PLANNING
Adaptive planning is the industry’s
UTILITY • FEBRUARY 2014 WWW.UTILITYMAGAZINE.COM.AU 66
WATER/DAMS
way of managing risk associated with variables that influence demand for water. A number of utilities have created approaches incorporating:
• the identification of flexible portfolios of water supply and water efficiency options. These may be at the site scale (eg household rainwater tanks), the local scale (eg third pipe recycled water schemes), and at the city/regional scale (eg large scale seawater desalination plants)
• scenario planning, combined with risk assessment
• development of severe drought contingency plans.
For further details refer to WSAA’s paper on ‘Urban Water Security’ (2013).
USING DAMS TO STORE DESALINATED OR RECYCLED WATER
Dams can also play a role as storages for climate independent sources of water like seawater desalination and recycled water. Dams in Perth are regularly used to balance storage for sources ranging from surface and groundwater to desalination, before distribution to customers in periods of greater demand. In some other cities dams may also be used to store desalinated water when the plants are operating. In Melbourne, Cardinia Reservoir will be used to store water from the Wonthaggi seawater desalination plant. Australia does not currently replenish its dams with highly treated sewage. Other parts of the world do. In Singapore approximately 11 million litres of recycled water is added every day to a reservoir, then further treated as part of Singapore’s normal drinking water treatment system. This source meets 30 per cent of the nation’s water needs.
DEVELOPING TECHNOLOGIES TO DECREASE EVAPORATION FROM DAMS
The dams that are more vulnerable to climate change will be the larger
To dam or not to dam
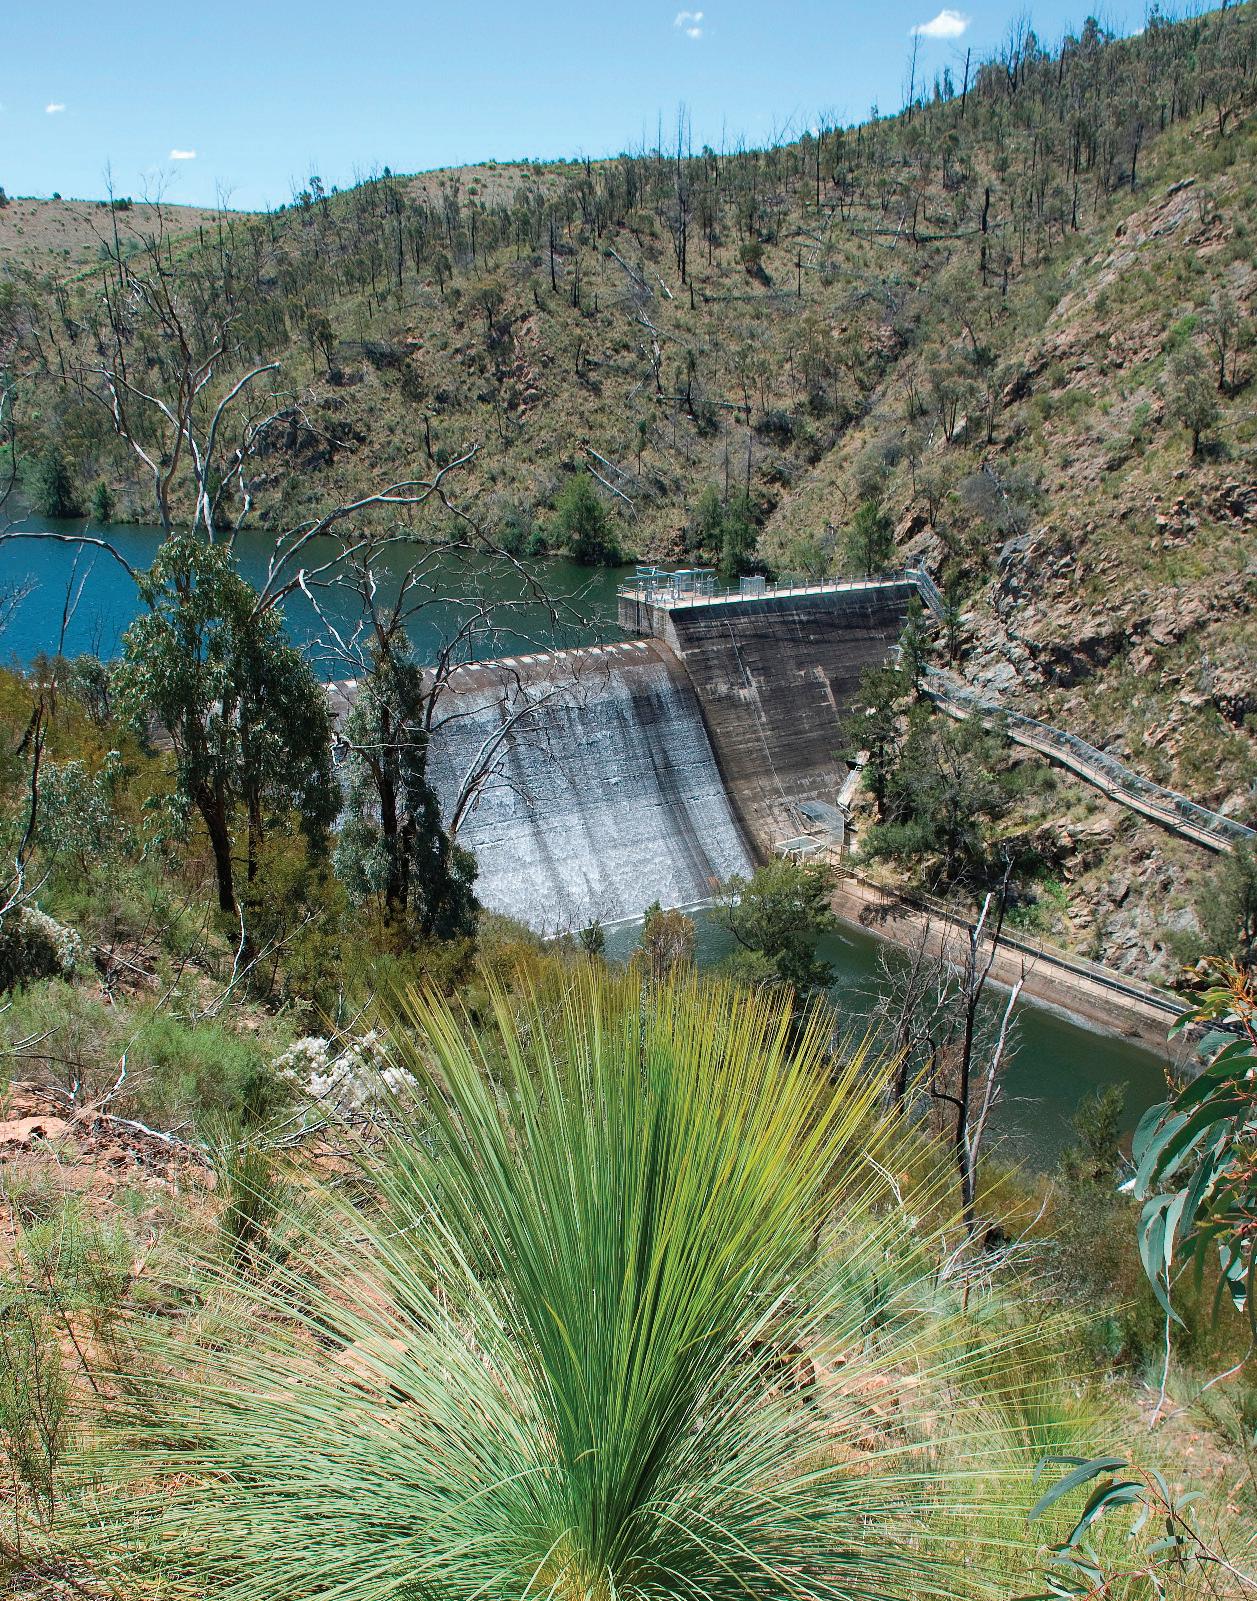
shallower ones in areas where high evaporation rates are most likely to increase. Even now, annual loss of water from storages through evaporation can exceed 40 per cent of water stored over a year (Prime et al. 2012).
The volume of water lost through evaporation from dams in South East Queensland is roughly equal to that supplied through the distribution system, 300GL according to the Urban Water Security Research Alliance (Yao X et al. 2010). By contrast, Sydney’s evaporation rate is approximately 100 GL/yr (or 20% of volume supplied), by virtue of the deep storages and low surface area to volume ratios.
Developing new technologies to reduce evaporation is important. Food grade polymer modules that float on a
dam have been trialled in the northwest of Victoria with great success – 88% reduction in evaporation, with positive effects on water quality with lower temperatures maintained (GWMWater 2011).
VALUING ECOSYSTEM SERVICES
As stated earlier catchment ecosystems provide important ‘natural’ infrastructure for water quality and supply, and protection against water-related hazards. A multiple barrier approach recognises this. Valuing ecosystem services can help WSAA members deliver on their goals, but a key shift needs to occur beyond just the ‘valuation’. Catchment ecosystem values need to be integrated into utility and regulatory decision-making processes.
WWW.UTILITYMAGAZINE.COM.AU UTILITY • FEBRUARY 2014 SECTION 67
WATER/DAMS
To dam or not to dam
This means counting catchments as corporate assets. It means factoring the value of ecosystem services into the investment appraisals and cost-benefit analysis applied to water investments.
To demonstrate the broad economic values attributed to natural assets, Melbourne Water recently attempted to quantify the other benefits associated with Cardinia Reservoir (a catchment area and man-made receiving body for water from Silvan Dam and the Wonthaggi seawater desalination plant), as well as the adjoining recreation area, and the Cardinia Creek. In total the value of those natural assets is estimated to be about $173m.
PROTECTING RIVERS – THE ROLE OF ENVIRONMENTAL FLOWS
Rivers, streams and wetlands need certain amounts of water at certain times to support healthy aquatic ecosystems. In rivers with dams, or those used for irrigation or disposal of treated sewage, this normal flow is changed. To compensate, water may be released from dams at certain times to allow rivers to function normally. Water may also be protected from abstraction –where water is removed from a river for irrigation or some other purpose (ACT Govt). Every state in Australia has laws and/or guidelines governing abstraction rates from rivers as well as the amount of water needed in reserve to protect the natural flow of our rivers.
For example in the ACT, environmental flow volumes required by regulation change in response to whether or not the ACT is under water restrictions due to drought. In 2012 a total of 374GL or environmental flows came from the dams on the Cotter and Queanbeyan rivers, and from the Lower Molonglo water treatment plant in the ACT. Due to good rainfall in these catchments in 2012 all of the dams overspilled and
released more water that the regulated environmental releases.
CONCLUSION
Building dams may over the long term provide low cost supplies. Initial construction costs, however, are high. Dams can have significant local environmental impacts, including changes to flow regimes in rivers, reduced downstream environmental flows and submergence of land, as well as dislocation of communities. Other options such as seawater desalination, recycled water, rainwater and stormwater harvesting may secure water needs.
To manage climate, population growth, economic and technological uncertainties, it is critical to identify, assess and regularly review various portfolios of supply augmentation and demand management options for a system. However, every urban water system is unique. Good, robust collaborative planning between the industry, regulators and communities is also required. In some locations, dams will be the appropriate solution to meet future water supply needs. Australia has not stopped building dams for public water supply as this paper shows through the example of the recent enlargement of Cotter Dam. However, the long-term drying trend in southwestern Australia (evident from the mid-1970s) currently places this area and the city of Perth in a position where it is unlikely that any new dams will ever be built to meet Perth’s public water supply needs.
Building new dams is one option for managing Australia’s future water needs. Against a backdrop of changing climate conditions and growing populations, increasing focus on Integrated Water Cycle Management and a portfolio approach to managing water supply and demand, means that dams will continue to play a principal role in meeting water needs.
This article has been adapted from an information paper produced by the Water Services Association of Australia (WSAA) and is used with permission. For the full report and other information and resources, please visit www.wsaa.asn.au
REFERENCES
Barwon Water (2012), ‘Water supply demand strategy 2012-2062’, Barwon Water.
Bureau of Meteorology (2011), ‘Special climate statement 24’, National Climate Centre, Bureau of Meteorology.
CSIRO and Bureau of Meteorology (2007), ‘Climate change in Australia: technical report 2007’, CSIRO.
CSIRO (2010), ‘Climate variability and change in south-eastern Australia: A synthesis of findings from Phase 1 of the South Eastern Australian Climate Initiative (SEACI)’, CSIRO. GWMWater (2011), ‘GWMWater Sustainability Report 2010/11’.
Insurance Council of Australia (2013), ‘Historical Data Statistics’, Insurance Council of Australia Limited, <www. insurancecouncil. com.au/industry-statistics-data/disaster-statistics/historical-disaster-statistics>.
IPCC (2012), ‘Managing the risks of extreme events and disasters to advance climate change adaptation: a special report of the Intergovernmental Panel on Climate Change’, Field C B, Barros V, Stocker T F, Qin D, Dokken D J, Ebi K L, Mastrandrea M D, Mach, K J, Plattner G K, Allen S K, Tignor M, & Midgley P M (eds), Cambridge University Press, Cambridge, UK and New York, USA.
Melbourne Water (2008), Evaluating Melbourne Water’s natural assets: preliminary investigation into the development of an evaluation methods, Melbourne Water.
Prime E, Leung A, Tran D, Gill H, Soloman D, Qiao G, & Dagley I, (2012), ‘New technology to reduce evaporation from large water storages’, Waterlines Report, National Water Commission, vol. 80.
Productivity Commission 2011, Australia’s Urban Water Sector, Report No.55, Final Inquiry Report, Canberra.
Rafter T & Abbs D (2009), ‘Calculation of Australian extreme rainfall within GCM simulations using Extreme Value Analysis’, CAWCR Research Letters, 3:44-49.
SA Water & University of South Australia (2009), ‘Briefing paper: investing in catchments as water infrastructure: the case of Blue Lake, Mount Gambier’, this paper was produced as part of the “Catchments as Assets” Project.
Steffen W, Hughes L & Karoly D (2013), ‘The critical decade: extreme weather’, Climate Commission. Westra, S., Evans, J.P., Mehrotra, R., and Sharma, A. (2013), ‘A conditional disaggregation algorithm for generating fine time-scale rainfall data in a warmer climate’, Journal of Hydrology, 479: 86-99.
WSAA (2012), ‘Climate change adaptation in the Australian urban water industry’, Water Services Association of Australia.
WSAA (2013), ‘Urban water security’, Water Services Association of Australia.
Yao X, Zhang H, Lemckert C, Brook A & Schouten P 2010, ‘Evaporation reduction by suspended and floating covers: overview, modelling and efficiency’, Urban Water Security Research Alliance Technical Report No. 28
UTILITY • FEBRUARY 2014 WWW.UTILITYMAGAZINE.COM.AU 68
WATER/DAMS
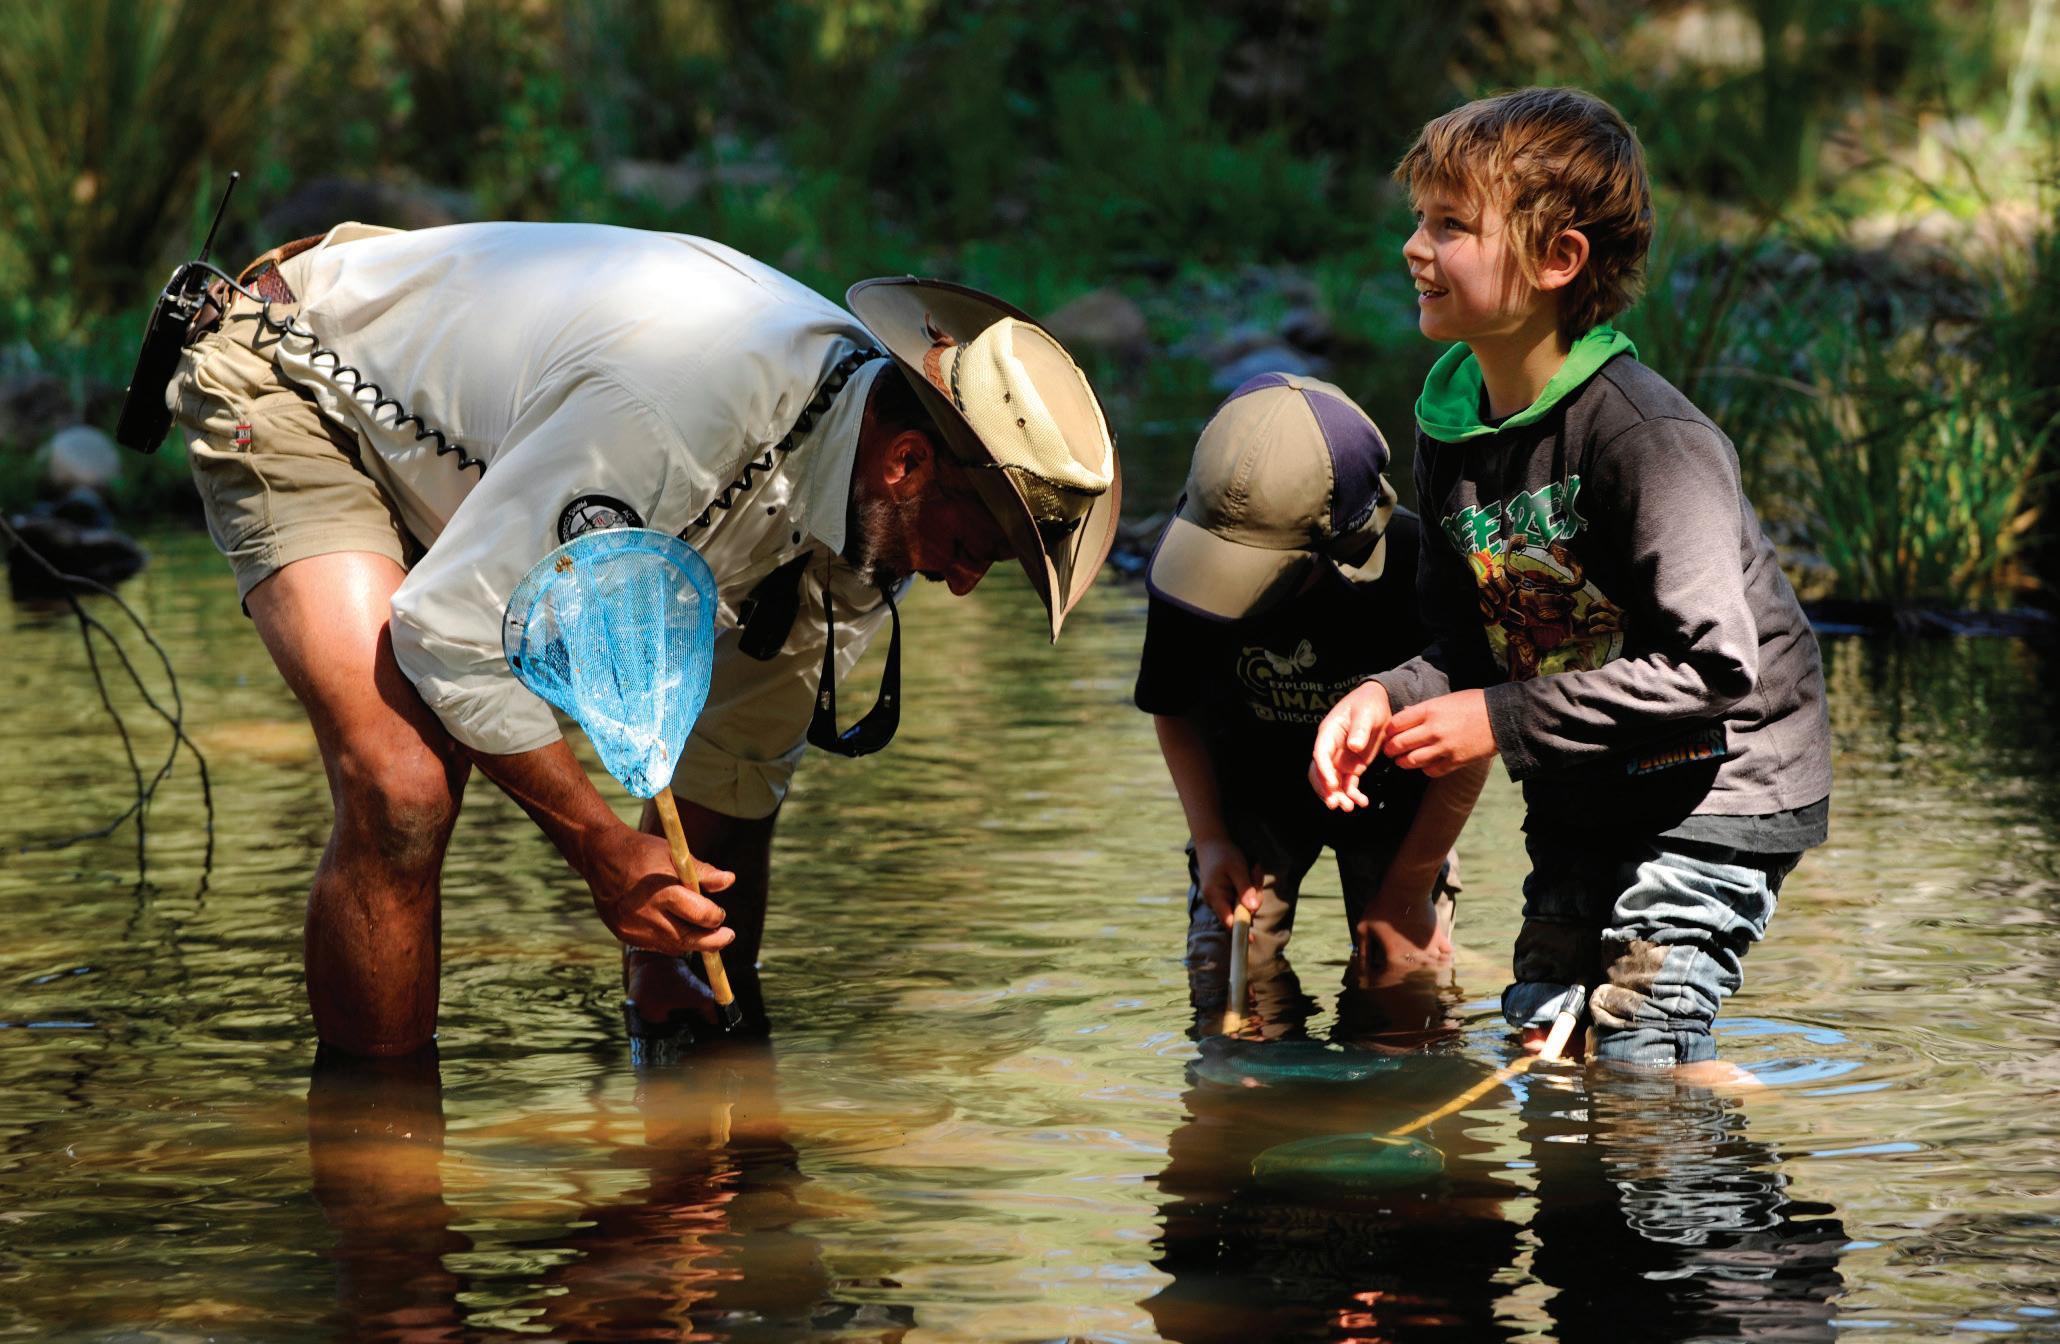
COTTER DAM ENLARGEMENT
History, heritage and the environment are as important as the bricks and mortar (figuratively speaking) of this new generation of roller compacted concrete dams.
Just as the original dam formed a firm foundation around which to build our national capital a hundred years ago, so too will the new dam provide a foundation on which to build Canberra’s second century of development. At nearly twenty-times the capacity of its predecessor, the new dam will boast a storage capacity of more than 78 Gigalitres, boosting the ACT’s overall water storage capability by 35 per cent.
In a community ravaged by ten years of drought at the start of the millennium,
this will provide long-term water security for future generations, and the basis on which to continue the territory’s rapid growth.
Years of debate gave way to years of planning – it was important to get it right from the start. While the original dam had, at just 18 metres, little impact on the vast valley, the new dam would tower over the Cotter reserve at 80 metres – the height of a 26 storey building. Its impressive stature would be visible for miles. Environmental aspects had to be carefully considered and the wealthy heritage of the area further enriched.
Garrett Cotter’s legacy is preserved in the Cotter Dam Discovery Trail, a 1.4 kilometre walking trail which has now
reminded more than 200,000 visitors of the area’s heritage and rich natural history. Preserving the plant and wildlife of the area was always a fundamental aspect of the project team’s work.
Around 200 indigenous Grass Trees (xanthorrhoea) were preserved, taken from the construction site and carefully moved to the National Botanic Gardens and the fledgling National Arboretum. But it is perhaps the protection of the endangered Macquarie Perch that is the project’s greatest environmental achievement, building the world’s first freshwater rock reef, a 7 kilometre weaving wall of giant boulders, carefully placed one-by-one into position to create a safe environment for the
WWW.UTILITYMAGAZINE.COM.AU UTILITY • FEBRUARY 2014 SECTION 69
WATER/DAMS
indigenous species, protecting the slim population from marauding cormorants.
The project team worked closely with the University of Canberra’s Dr Mark Lintermans, a Senior Research Fellow in Freshwater Fisheries Ecology and Management, with some 30 years’ experience. Lintermans helped design the infrastructure and his studies on the perch population provided the evidence on which to base what he described as a ground-breaking project. “The fish research and management program associated with the ECD is world class, and has provided opportunities for fish conservation that otherwise would not have been available. The genuine interest in fish conservation by ACTEW and the BWA has facilitated a strong partnership approach with the University of Canberra that has delivered security of water supply along with improved outcomes for threatened fish species.”
The research is going well and early signs indicate that the population is thriving, with tests on the stomach contents of the perch revealing a healthy diet of earth worms picked off as they rise to the surface investigating the impounding waters of the Cotter Reservoir.
Like most of the construction aggregate used on site, the rock reef boulders were quarried from the walls of the abutments. Sourcing a million tonnes of construction material in this way, to be ground down and turned into concrete at the site’s batch plant, would save the project 2.8 million construction kilometres, enough to circumnavigate the earth 71 times, making a huge saving in the dam’s carbon footprint. ACTEW and its Bulk Water Alliance construction partners John Holland, GHD and Abigroup, committed to offsetting all carbon emissions associated with the construction. A large part of that is the rehabilitation of 420 hectares of native land in the dam’s catchment area.
‘Sourcing locally’ was very much
the mantra in sourcing the project team and contractors. In consultation with groups like the Master Builders Association and civil construction companies, the project team was able to better understand local business needs and reach an acceptable balance within the industry. At its peak, around 400 employees were working on the construction of the dam. The project team was comprised of around 61% local employment, with about 34% of all contractor businesses and suppliers sourced locally. This helped to inject around $88million into the local economy.
Furthermore, the very purpose of the dam is to provide long-term water security to the community, helping Canberra to avoid the more severe water restrictions which might have affected the city in the past. According to research from the Centre of International Economics (CIE), Stage 3 water restrictions could cost the ACT economy in the region of $180million each year.
David Pearce, CIE’s Executive Director said: “While most costs accrue to households, some also arise for commercial activities and water intensive businesses. In addition, the tourism sector is affected by restrictions. The magnitude of these costs can be measured by observing the effects of restrictions on particular activities. These latest estimates suggest that, for example, the total cost of spending per year in stage 3 restrictions, is around $180 million. The potential cost of a year spent on higher levels of restrictions (stage 4, which does not allow any outside use) is much higher still at around $540 million.”
Preserving the history of the area was fundamental to the construction team and particularly the indigenous heritage. In consultation with the Yurung Dhaura Indigenous work group, a nursery of bush medicine and traditional food species was planted. A new trail network was formed from
the project’s haul roads, the largest of which was named after the young indigenous leader Honyong, who first led Irish convict drover Garrett Cotter to the banks of the river, abundant in pure, fresh water. Also preserving the history of the modern-day settlers was the modernisation of Cotter Avenue, a popular picnic area for generations of Canberrans. New barbecue, picnic and toilet facilities were introduced. This initiative doubled with the redevelopment of Casuarina Sands, as an alternative while the avenue was renovated.
Engaging the ACT Government’s Parks and Conservation Services’ Brett McNamara as an adviser, and a key component on the environmental and heritage aspects of construction, was fundamental to the success of the project. Brett believes the shared vision was what made the project so successful, “I can recall early conversation based on the premise of ensuring that post Dam construction, we would have an enduring and lasting legacy.
Today as you stroll down the majestic tree lined Cotter Avenue we have collectively achieved that vision.”
With Canberra’s centenary approaching, it was important that the construction was recorded for future generations. Just as the building of the original Cotter Dam and associated pump house was photographed for posterity, and used to mark 100 years of engineering in the capital, so too our contemporary engineers used digital technology to record the building of this modern engineering feat. The project and its people were recorded by local documentary maker Richard Snashall, who has so far produced around 60 short films. Renowned Canberra landscape photographer, Col Ellis has documented the land and the construction through a series of 50 events producing a library of images that will mark the construction for future generations.
Preserving the construction and the history of the area for future
UTILITY • FEBRUARY 2014 WWW.UTILITYMAGAZINE.COM.AU 70
WATER/DAMS
Cotter Dam enlargement
Cotter Dam enlargement

generations and inspiring young people to create their own engineering stories is something that has always been important to the construction team.
The Cotter Dam’s associated education program has engaged with more than 1600 young people, teaching them about the role the River Cotter played in the location of our nation’s capital. It also promotes the importance of protecting the water catchment, and following a decade of drought, water’s role as a vital natural resource.
The Enlarged Cotter Dam project was part of a wider program of major water security projects which also included the construction of the Murrumbidgee to Googong (M2G) pipeline, the upgrade of the Googong Dam Spillway (GDS) and the Murrumbidgee to Cotter upgrade of the 100-year old Cotter pump station. Together, these projects would provide water security for future generations of Canberrans. The M2G project would replicate the environmental elements of the Cotter Dam enlargement. Working with the Australian National Botanic Gardens the construction team endeavoured to preserve the endangered small purple pea, Swainsona recta. Seeds were collected and germinated before seedlings were
planted around the Williamsdale region. The plants are now flowering profusely, producing healthy seeds that have been collected and deposited safely in the National Seed Bank.
The Cotter dam construction project has had its fair share of hurdles to jump over. A geological fault that was only discovered during the excavation phase of the project set work back by a number of weeks and added millions of dollars to the budget. But while the project team did everything to protect nature, nature would strike back with awesome force. Just two days after the completion of the nearby Googong Dam Spillway upgrade project, the clouds that had been gathering over 10 years of drought burst and the spillway did the job it was designed to do admirably. In March 2012 nature exacted vengeance with a flood so intense that it threw scaffolding about like sticks. Tree trunks left ravaged by the bushfires years previously were left scattered across the construction site. The damage would take weeks to clear and cost the project tens of millions of dollars. Had the wall been complete, the inundating waters would have filled the dam twice over.
The dam, and indeed the wider Cotter Reserve was returned to the community in October 2013. Launched by Chief Minister Katy Gallagher, Canberra came out in force to celebrate the achievement. Just as enthusiasts had clamored a few short months before to walk along the crest, so too they headed to the Cotter to walk through a million tonnes of concrete and celebrate the opening with the unique experience of walking through the maintenance gallery area of the dam wall. Thousands enjoyed the family festivities and counted the 296 stairs from bottom to top.
The project has grabbed the imagination of the community, with Dam Cam – the strategically positioned web camera recording every minute of construction – being eagerly followed by thousands of enthusiasts. It has been among the most viewed pages on the ACTEW website. It has inspired future generations of engineers as young boys and girls learned about the construction, environmental engineering and the importance of water as a raw natural resource. Families have returned to the Cotter in droves, with the project team and its partners delivering modern facilities for a traditional picnic venue under the project’s heritage banner.
The construction has always looked to the future, in developing innovative building methods, new environmental thinking and working in partnership with numerous stakeholders. However, first and foremost it looked to provide essential water security for future generations of Canberrans and support the economic growth and development of our capital, regardless of what population growth or our changing climate might throw our way – it has been and always will be a little Aussie battler.
WWW.UTILITYMAGAZINE.COM.AU UTILITY • FEBRUARY 2014 SECTION 71
WATER/DAMS
ENSURING QUALITY
By Andrew Allan, National President, Stormwater Australia
2014 is shaping up to be a big year for Stormwater Australia, the new identity of the Stormwater Industry Association of Australia. Over the past few years the association has been steadily growing in confidence and stature as it forges a leading role in setting a vision and direction for the management of stormwater in Australia.
With the third national conference scheduled for October in Adelaide, there is strong momentum beginning to build behind another priority flagship project to establish a process to verify and recognise product performance claims in the marketplace.
Responding initially to a call by the product supply sector of the industry Stormwater Australia has undertaken extensive research on the state of play across industry and models of assessment and verification that could be used in Australia.
As an industry which has an intrinsic interest in supporting effective investment in as much as one half of all money spent on water management in this country it is imperative that specifiers, owners and ultimately the
public have confidence in the ability to deliver required outcomes.
Over the past decade there has been a quiet revolution going on which has seen increased awareness in the need to manage stormwater to achieve environmental outcomes along with traditional drainage function. For a couple of decades now there has been a focus on managing the quality aspects of stormwater, more recently the need to control volumetric impacts associated with runoff (and especially stream morphology and ecology) have been growing in importance.
Stormwater quality improvement can be achieved in many different ways but systems often employ a proprietary device to remove particular pollutants. To contribute positively

and rise to the challenge to provide consistent and comparable information the industry needs to establish a standardisation of approach and a trusted process to validate performance claims of different devices. This has been identified as priority action for Stormwater Australia to process through our Stormwater Quality Improvement Device (SQID) project over the next 12 months. While further consultation to develop detail occur will early in 2014 through Stormwater Australia, there are some emerging lessons from the analysis undertaken to date which will underpin the way forward. Devices should be:
SUPPORTED
Stormwater Australia represents
UTILITY • FEBRUARY 2014 WWW.UTILITYMAGAZINE.COM.AU 72
STORMWATER

manufacturers, suppliers, specifiers, designers, installers and operators of stormwater systems. Moving forward the SQID project needs to build upon the current levels of support and recognise an end point which will serve the collective good.
USEABLE
Information needs to be presented in a user-friendly, easy to understand format which takes in the broader needs of designers, specifiers, installers and operators beyond just treatment aspects.
CREDIBLE
Evidence based claims should be assessed by a trusted panel of experts using understood and accepted scienctific methods to ensure accountability.
VIABLE
Needs to generate revenue to support a robust assessment process and ensure information remains current and accurate.
SCALABLE
The development of knowledge is a continuous processes and should be undertaken to increase confidence to support outcomes.
ACCESSIBLE
Experience tells us the world isn’t static, and our industry is no different. When designed well, a scheme should be accessible to new and established players and recognise and support the innovation and product development.
We would encourage infrastructure
managers from across Australia to find out more Stormwater Australia’s approach. Ultimately we are all working to achieve a common outcome of providing effective and functional solutions for the community and the environment.
For more information visit www.stormwater.asn.au
WWW.UTILITYMAGAZINE.COM.AU UTILITY • FEBRUARY 2014 73
STORMWATER
THE WAY WE WERE: CHRIS GEEHMAN
The utility industry has seen a lot of change over the past few decades. In the first of an ongoing series, we talk with retired utility professionals to find out more about their careers and perspectives. In this issue we talk to Chris Geehman, whose career took him from the State Rivers & Water Supply Commission, which eventually became South East Water, overseeing their largest ever construction project, to a stint in the private sector.
HOW DID YOU GET STARTED IN UTILITIES?
I graduated in 1973 as a Bachelor of Civil Engineering from Monash University.
Back in those days my father strongly encouraged me to get a job with the government; “A secure job, with great benefits”. Later in life I was able to make him eat those words.
Anyway, on 14 January 1974 I joined the (then) State Rivers & Water Supply Commission, which was responsible for all the irrigation works in the State (except Mildura) along with the provision of town (urban) water supplies to just about everywhere outside of the Melbourne Metropolitan area. It was a fantastic organisation for a new engineer as they had a three year training scheme where you were sent for nine month stints to each of the four major components – Investigation & Design, Main Urban Supplies, Rural water Supplies and Construction.
As a result of Government re-structuring of the water industry over the years, I worked for the various
successor bodies namely: Mornington Peninsula & District Water Board, Melbourne Water and South East Water Limited. I was at the latter until I left in 2007 and joined the consulting engineering company of Connell Wagner, now Aurecon. I worked there until my retirement in 2010.
HOW DID THE INDUSTRY CHANGE DURING YOUR TIME IN IT?
There have been a lot of changes to the water industry since I joined in 1974. Firstly there was the closing down of “The Rivers” around 1986, leading to the formation of a number of individual irrigation areas in the State, along with the combining of small water and sewerage boards into large ones covering a greater area and population. This was both a sad and exciting time for me personally. ‘Sad’ because The Rivers was like a big family and it had put me onto a career path that I never regretted taking. ‘Exciting’ because I was now with the Mornington Peninsula & District Water Board (MPD&WB) and you could already

anticipate a lot of the benefits that would result from this new arrangement. No more having to refer matters to “Head Office” for a decision, less red tape, etc.
There have been a lot more changes since then; some for the good and some for the not-so-good. The latter was exemplified, in my opinion, by the Government decision to combine the MP&DWB with the Melbourne & Metropolitan Board of Works (MMBW) to form Melbourne Water in 1991. This was certainly a backward step in terms of administration efficiency, cultural amalgamation and clashing of procedures. There was the ridiculous situation, again in my opinion, of forming this huge organisation when everything previously had been about being smaller, more efficient, etc. Ah, on such things do Governments justify themselves.
Sanity seemed to return in 1995 when the Kennett Government split Melbourne Water up into the wholesaler, Melbourne Water, and three retail companies being City West Water, Yarra
UTILITY • FEBRUARY 2014 WWW.UTILITYMAGAZINE.COM.AU 74 HISTORY

Valley Water and South East Water. Of course there was more to this arrangement than first met the eye. It may be recalled that at this time the Kennett Government was on its privatisation march and was breaking up and selling many Government owned industries, including electricity and gas, and the Water Industry was to be the next on the agenda. However, privatisation did not proceed after a cryptosporidium (water bacteria) scare occurred in Sydney and the Victorian politicians of the day re-thought the matter.
WHAT WAS IT THAT ATTRACTED YOU TO THE INDUSTRY?
As a Civil Engineer I always wanted to be involved in building things. This was realised for me during my career in the Water Industry. I got experience in planning, investigating, designing (not my favourite discipline I have to admit), construction, operation and maintenance of some pretty amazing pieces of infrastructure. I got to work closely with other engineering disciplines and became involved with estimating, financial control and people management. Private industry at the time could not give such opportunities for engineers at the scale of what the utilities were doing.
Also the Water Industry has always tried to look “long term”. It was
building assets for the State that it expected to last 100 years with the consequent expense that this entailed. This philosophy is not so popular these days with water utilities required to provide the Government with appropriate annual dividends and consequently have to adjust their budgets accordingly. The utilities are always looking at ways to reduce costs – and rightly so – but there comes a time when such cost-cutting is detrimental.
WHAT IS THE MOST MEMORABLE MOMENT FROM YOUR CAREER?
In 2003 while with South East Water Limited (one of Melbourne’s three retail water companies), I project managed the Hallam Valley Main Sewer Project, which was required to relieve an overloaded urban sewerage system that during storm events was subject to sewage pump station spills and occasional discharges within private properties.
The project was located in one of Melbourne’s fastest growing ‘growth corridors’ and for me it involved:
• Engaging and managing a firm of consulting engineers preparing the detailed design and later acting as Superintendent of the Contract;
• Preparing the tender documentation, calling and assessing
tenders;
• Preparing reports to the Board for approval;
• Acting as the Principal’s Representative under the Contract. The actual works comprised:
• Some 8.5km of 1500mm gravity sewer (reinforced concrete jacking pipes, PE lined to prevent H2S attack) installed by pipejacking;
• Generally at depths between 8 and 11 metres;
• Grade of 1 in 1,000 (0.1%);
• 34 Maintenance Holes of 2.5, 3 and 4 metre diameter;
• Over 1 km of 900mm gravity sewer – with more than twothirds installed by pipejacking;
• Decommissioning of 6 pumping stations
At a total estimated cost of $37.5M it was South East Water’s largest construction project.
In spite of some difficult conditions such as a high water table, encountering rock and flooding of the site, the construction was completed in May 2006 some five months early. While the cost was approximately $0.9M over the 2003 approval, this included a $1M worth of additional work that was brought forward from the following year’s program.
As I had been involved with the
WWW.UTILITYMAGAZINE.COM.AU UTILITY • FEBRUARY 2014 75 HISTORY
WORKS PREPARING THE TUNNEL BORING MACHINE 10 METRES BELOW THE SURFACE IN NARRE WARREN SOUTH AS PART OF THE HALLAM VALLEY SEWER PROJECT WHICH WAS MANAGED BY CHRIS.
Chris Geehman
Project from start to finish, and this does not always happen under such long projects, I came away with a great sense of pride and satisfaction.
Another memorable moment was at the 2010 Australasian Society for Trenchless Technology (ASTT) Conference at Coffs Harbour, NSW. I had been asked to attend in order to be a member of an ‘expert panel’. However, it turned out that the main purpose of getting me to the Conferences was to present me with the ASTT’s Person of the Year (POTY) Award. To say that I was ‘gob-smacked’ would be an understatement as I had never envisaged that I would be so honoured by ASTT, especially when I knew there were many others more deserving than I.
WHAT ADVICE WOULD YOU GIVE TO SOMEONE STARTING OUT IN THE INDUSTRY TODAY?
Unfortunately today’s life philosophies seem to have too much focus on the “now’; about what can be obtained as quickly as possible and worry about the repercussions and consequences later. I believe that if you are working in a utility such as the Water Industry you have to look long term and this applies especially to the infrastructure. Once these assets, such as pipelines, are built you do not want to have to touch them for a long time. Melbourne’s old sewerage system is a fantastic example of this philosophy.
My last job (with Aurecon) was as a Project Manager for the client, Melbourne Water, for the replacement of the 100+ year old Melbourne Main Sewer in Port Melbourne. This sewer had not only survived structurally but it had handled the rapid growth of our City and the sort of flows that the original designers could not have imagined. It was more the latter that necessitated its replacement rather than its structural soundness, which was very good considering where it was located and how it had been built in the late 1800’s.

We still need to ensure that our thinking goes beyond the current 5 or 10-Year Strategic Plan when we are designing and building assets.
Also the Water Industry focus (at the time I left South East Water) seemed to be on presenting a good public image and of generating additional revenue. For example, at that time the ‘Marketing/P.R.’ department at South East Water had more staff than the group responsible for spending $16M on renewing ageing water mains. The Strategic plan contained, as I recall, less than a page on what the organisation was going to do in order to maintain its thousands of kilometres of water and sewer pipelines.
It needs to be remembered that a Water Company’s ‘reason for being’ is the provision of water and sewerage service to its customers.
HOW ARE YOU SPENDING YOUR TIME IN RETIREMENT?
My only involvement today is social contact with former colleagues. At these informal gatherings we reminisce about the “good old days”, which at the time weren’t old and often weren’t good!
I am currently involved with lawn bowls and play three times a week. Also I am Secretary of my club and this alone probably takes up about 10 hours a week.
Earlier this year my wife and I had our kitchen renovated and I put my project management skills to good use. I found I still have the knack for organising contractors and getting the job done on time and to budget (well almost) and I also did the painting. This, of course meant that the rest of the interior had to be painted and I managed to fit that in between holidays.
Earlier this year we did a short caravan trip to Sydney to visit friends and in September went to New Caledonia. Last year we went to Europe for eight weeks and in 2011 visited Vietnam. We are now planning a trip to New Zealand in 2014 to do the Milford Sound Walk and later next year we hope to go to the USA & Canada.
I also try to fit in an occasional game of golf.
As my father used to say, “I had more spare time when I was at work!”
UTILITY • FEBRUARY 2014 WWW.UTILITYMAGAZINE.COM.AU 76
HISTORY
CHRIS PICTURED HERE WITH HIS WIFE AT ONE OF THE LOOK-OUTS, RIOMAGGIORE, CINQUE TERRE.
ACCESS DETECTION
As a supplier and trainer of detection equipment, Access Detection is able to assist our clients in selecting the best equipment for their needs.
We offer the only authorised service and manufacturer calibration service for Rycom instruments, Sewerin Water leak & Gas detection equipment and can also repair IDS GPR systems. All equipment is serviced here in Australia. We offer both in house training or can offer fully accredited Australian industry recognised locator courses for our clients.

RYCOM INSTRUMENTS
Rycom Instruments have been producing locators for the utility industry for over 60 years and offer an excellent range of locators to suit all budgets. The new Rycom V3 series offers new features normally found in more expensive locators. The Rycom CAP V3 was developed by Access Detection and Rycom and is a proven versatile easy to use cable avoidance tool. The units have recently been purchased by Sydney Water and Hunter Water for its simplicity of use while still retaining excellent accuracy. The new Rycom 8869 V3 has been popular with both councils and NBN contractors due to the extra features, frequencies and 3 watt transmitter making it one of the most affordable units. Access Detection is the only authorised service centre for Rycom instruments here in Australia and the only company to offer full factory calibration services for this new series.
IDS GPR SYSTEMS
Access Detection have been working with IDS Australasia for just over 3 years and in this time have become their premium dealer for the Detector DUO. Companies, like Vacu Digga, Sure Search, Cardno AUS, RMS, Hunter Ground Search and many professional locate companies have come to depend on the DUO for locating critical assets. Advanced systems like the Hi MOD Stream EM take GPR to the next level with dedicated 3D mapping software. Before making a decision on GPR equipment IDS should be at the top of your list
SEWERIN WATER& GAS LEAK DETECTION
Sewerin have been manufacturing Water & Gas leak detection for over 60 years and are regarded as the premium leak detection provider. The Aquaphon A100, Aquatest T10 and Stethophon 04 offer excellent performance for Water Utility Detection and are used by many water authorities including Sydney Water, Hunter Water, Gold Coast Water, South East Water and many councils throughout Australia.
For any enquiries or questions with regard to our product range please contact Access Detection on (02) 9999 0777


77 WWW.UTILITYMAGAZINE.COM.AU UTILITY • FEBRUARY 2014 SECTION Advertorial SHOWCASE
AUSTECK INTRODUCES
REVOLUTIONARY INSPECTION SYSTEM TO AUSTRALIA
In keeping with our reputation for introducing cutting-edge technology to the Australian Market, Austeck announces its new partnership with German pioneer, Kummert.

Perhaps best known for the unique and quite revolutionary CamFlex® lateral inspection system, Kummert has been the company to watch in pipeline inspection technology over the past 5 years. Their “think outside the square” approach to age old problems has gained them international recognition and renown and secures their position at the forefront of industry innovation and development.
The defining feature of the CamFlex® system is the vermicular movement by which it navigates its way from mainline pipes into lateral lines. Unlike anything else currently available on the market, the patented mechanism enables unprecedented flexibility and durability, which, coupled with the integrated upright picture module, provides for effortless navigation of complete pipeline networks from a single inspection opening. A further development of the CamFlex® system has seen the incorporation of GPS and inclination sensors that facilitate the full “3D” mapping of pipe networks with astonishing accuracy. This is a technology that truly has to be seen to be believed.
The latest and possibly most anticipated development from Kummert to date however is the new CamMobile® Crawler.
Capable of inspecting pipes from 150mm through to 1000mm in diameter it is the only system on the market to cover that range from a single crawler/camera configuration and is capable of traversing that range from a single setup. Propelled via 4 independent, optically controlled, brushless, direct drive motors the CamMobile® Crawler delivers 50% more power than other crawlers in its class with minimal wear and tear. An inbuilt accelerometer ensures that the unit always stays centred in the invert of the pipe by automatically adjusting the power distribution to each of the motors when the need arises. The integrated lowering hook and claw ensure the unit can be simply and safely lowered in and out of manholes and maintenance shafts without risk of injury to the operator or damage to the equipment.
Despite these attributes the most groundbreaking aspect of the CamMobile® Crawler is in fact not the crawler itself but the camera. Utilising the latest Progressive Motion Still technology the camera captures images with unparalleled clarity while the strobing LED (24 flashes per second) light source reduces the power consumption by 80%. The digitally enabled “human perspective” camera
view with intuitive joystick control make the system the most user friendly on the market.
Completing the system are the fully automatic cable drum, that holds up to 320m of cable yet is still light enough be lifted with one hand, and the CamMobile® Profi 3 control consol. Fully Windows based and WinCan compatible, the Profi 3 is portable, easy to use and robust. But, perhaps most importantly, putting functionality aside, the system is without doubt the most serviceable and ergonomically engineered we have ever seen. Major components inside the system are accessible within minutes as opposed to hours eliminating the arduous dismantling and rebuilding requirements of cumbersome and over complicated assemblies common to other brands. Component level repair is now a thing of the past resulting in dramatically less downtime with increased reliability and productivity.
The Kummert system is sure to be greeted with the same interest and enthusiasm here in Australia as it has been overseas.
All equipment is covered by Austeck’s Serviced Lifetime Warranty (conditions apply).
78 UTILITY • FEBRUARY 2014 WWW.UTILITYMAGAZINE.COM.AU
Advertorial
SHOWCASE
VERMEER’S INSITE™ ASSET MANAGEMENT GIVES CONSTRUCTION FLEETS
REAL-TIME INFORMATION
Vermeer introduced a new telematics system at the 2013 International Construction & Utility Equipment Exposition in Louisville, Kentucky. The InSite asset management system (InSite) is designed for utility construction contractors and provides real-time machine data so that fleet managers and business owners can make informed decisions on how they utilise and maintain their equipment.
“The InSite asset management system provides asset owners the ability to receive real-time machine data, which allows them to make informed decisions,” said Jon Kuyers, Global Product Manager for underground at Vermeer. “Having quick access to usable information provides owners with a competitive advantage to potentially improve productivity.”
The InSite system provides real-time data on a machine’s utilisation, health and maintenance needs. This system was designed for utility construction fleet owners, whether they are large fleet owners or smaller contractors. A contractor/ equipment owner can quickly gather information on hours of machine operation and fuel consumption and diagnose errors based on alerts received. In addition, machine owners can benefit from GPS positioning functionality to track a machine’s location, utilisation and scheduling, as well as function as a theft deterrent. The major features of the InSite system are:
Machine health monitoring: Provides alerts for specific machine functions which help identify when issues may occur GPS locating: Reduces amount of time it takes to locate an active or inactive machine, as well as acts as a theft deterrent with user-defined geographical parameters
Machine utilisation: Allows fleet manager or owner to remotely monitor machine hours and fuel usage, enabling for proactive maintenance scheduling and helping to manage operating costs
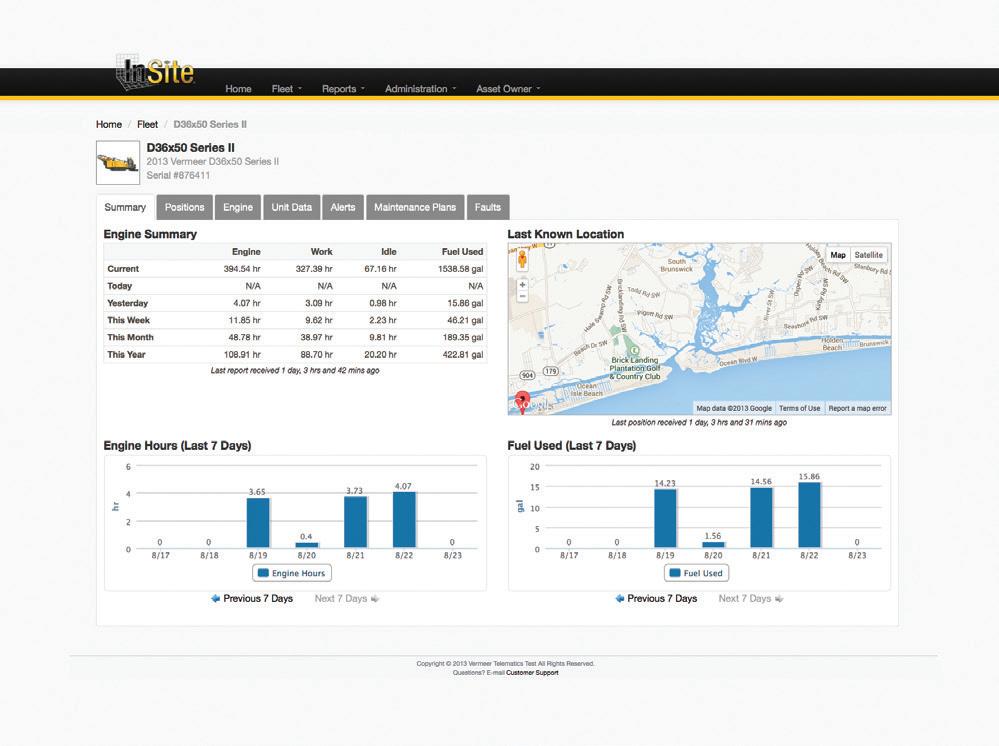
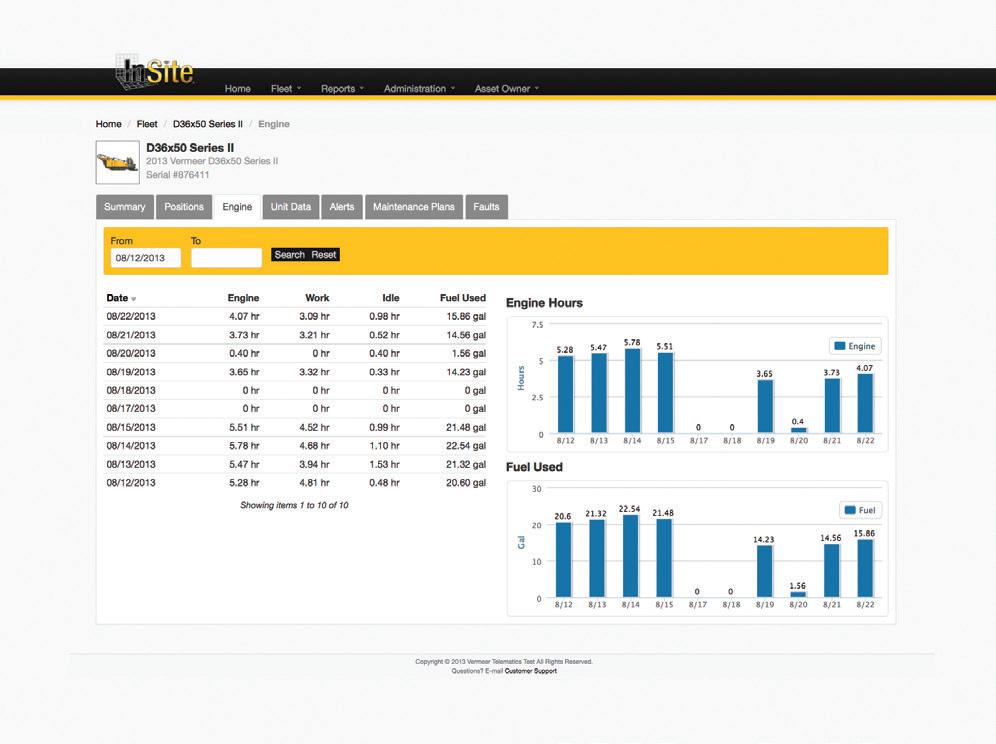
For more information on Vermeer products and services, visit the company’s website at www.vermeer.com.au or email Vermeer at sales@vermeer.com.au.
79 WWW.UTILITYMAGAZINE.COM.AU UTILITY • FEBRUARY 2014 SECTION Advertorial
SHOWCASE
EDITORIAL SCHEDULE
MAY 2014
MAJOR FEATURES
OZWATER
WATER EFFICIENCY
ENERGY NETWORKS AND DISTRIBUTION
COAL SEAM GAS
AUGUST 2014
MAJOR FEATURES
STORMWATER
RENEWABLES
ASSET MANAGEMENT
RETAIL, BILLING AND CRM
NOVEMBER 2014
MAJOR FEATURES
DESALINATION
GAS PIPELINES
SMART GRIDS
ENERGY EFFICIENCY
FEBRUARY 2015
MAJOR FEATURES
WATER RECYCLING
SAFETY
SUSTAINABILITY
CONTRACTS AND RISK
SPECIAL FOCUS
INSPECTION, CCTV AND CONDITION ASSESSMENT
MICROTUNNELLING
MAPPING, GIS & SURVEYING
SPECIAL FOCUS
SCADA, CONTROL SYSTEMS, IT AND SOFTWARE
WASTEWATER TREATMENT
PIPE RELINING
DRAIN CLEANING
SPECIAL FOCUS
LAND ACCESS AND RIGHT-OFWAY
TRANSFORMERS AND SUSBSTATIONS
PIPELINE INTEGRITY, COATINGS, CATHODIC PROTECTION
LEAK DETECTION
SPECIAL FOCUS UTILITY LOCATION
TESTING AND MEASUREMENT
SEWER REHABILITATION
MORE TO BE ANNOUNCED
EQUIPMENT & MACHINERY
SMART METERS
COMMUNICATIONS DEVICES
TRENCHERS

EQUIPMENT & MACHINERY
PIPE & CONDUIT
CABLES
COMPACT MACHINERY;
EXCAVATORS, SKID STEER LOADERS
VACUUM EXCAVATION AND NON-DESTRUCTIVE DIGGING

EQUIPMENT & MACHINERY
PUMPS, VALVES, COMPRESSORS AND FILTERS
EQUIPMENT RENTAL
ATTACHMENTS AND BUCKETS
HORIZONTAL DIRECTIONAL
DRILLING (HDD)

EQUIPMENT & MACHINERY
SWITCHGEAR
LASER GRADING
LARGE EXCAVATORS
AND TRUCKS
MORE TO BE ANNOUNCED


80 UTILITY • FEBRUARY 2014 WWW.UTILITYMAGAZINE.COM.AU
ACCESS DETECTION
AERISON ....IFC AUSTECK OBC DETECTION SOLUTIONS 29 ENERGY NETWORKS 2014 IBC LORD CIVIL 27 ROYCE WATER TECHNOLOGIES 23 VERMEER 3 Advertisers’ index
31
