
SeaFurtherTM Sustainability is Cargill’s sustainable aquaculture initiative to reduce the carbon footprint of its customers’ farmed seafood by 30% by 2030.
»2 JUNE - JULY 2022 on coverthe FAO THE2022STATE OF WORLD FISHERIES AND AQUACULTURE: KEY MESSAGES INDEX Aquaculture Magazine Volume 48 Number 3 June - July 2022 Volume 48 Number 3 June - July 2023 Editor and Publisher Salvador Meza info@dpinternationalinc.com Contributing Editor Marco Linné Unzueta Editorial Coordinator Karelys Osta edicion@dpinternationalinc.com Editorial Design Perla Neri design@design-publications.com Designers Rozana Bentos Pereira Sales & Marketing Coordinator Juan Carlos Elizalde crm@dpinternationalinc.com Marketing & Corporate Sales Abril Fernández sse@dpinternationalinc.com Operations Coordination Johana Freire opm@dpinternationalinc.com Business Operations Manager Adriana Zayas administracion@design-publications.com Subscriptions: iwantasubscription@dpinternationalinc.com Design Publications International Inc. 401 E Sonterra Blvd. Sté. 375 San Antonio, TX. OfficeOffice:info@dpintertnatinonalinc.com78258+2105043642inMexico:(+52)(33)8000 0578 - Ext: 8578 Aquaculture Magazine (ISSN 0199-1388) is published bimontly, by Design Publications International Inc. All rights reserved. Followwww.aquaculturemag.comus: 44483834282216465369 INDUSTRY NEWS EDITOR´S COMMENTS ARTICLEARTICLEARTICLEARTICLEARTICLEARTICLEARTICLEARTICLEUPCOMING ADVERTISERSEVENTSINDEX
12
Evaluation of poultry by-product meal as an alternative to fish meal in the diet of juvenile black sea bass reared in a Recirculating Aquaculture System. Intelligent feeding technique based on predicting shrimp growth in recirculating aquaculture system. Evaluation of immune stimulatory products for whiteleg shrimp (Penaeus vannamei) by a metabolomics approach. Using alternative low-cost artificial sea salt mixtures for intensive, indoor shrimp (Litopenaeus vannamei) production.
Economic feasibility study of aerators in aquaculture using life cycle costing (LCC) approach.Thefuture of food from the sea. Protein hydrolysates from poultry by-product and swine liver as an alternative dietary protein source for the Pacific white shrimp.
» 3JUNE - JULY 2022 62 THE GOOD, THE BAD AND THE UGLY COLUMNS Is shrimp farming sustainable in its current form? By Stephen G. Newman Ph.D. * President and CEO, AquaInTech Inc. 66 THE FISHMONGER Do not panic... plan your survival. 6058 CARPE TECHNICALDIEMGURU It is time to think big or die trying! By Antonio Garza de Yta, Ph.D. Media for all kinds… By Amy Stone


2. Importance / relevance/ urgency. How urgent is the need? How important is bridging this par ticular gap to overall success?
Funding for aquaculture research and development, including demon stration projects, requires consistency, continuity, integration, and cost-ben efit assessment to ensure success and attract long-term private sector com mitment.Available programs should also be encouraged in the commercial aqua culture sector to support research into activities best suited to the de velopment of the area. Research ef forts should be undertaken with the goal of understanding the impact on the entire supply chain, e.g.: How will research results implemented in pro duction affect product quality and market value?
1. Feasibility. An assessment of the potential (technical, scientific, etc.) to overcome technological barriers: What is technically feasible? What can be achieved through research? How difficult is it to overcome the obstacle?
Based on SOFIA 2022 “The State of World Fisheries and Aquaculture”, an interaction is sought between the launch of the Decade of Action to Achieve the Global Goals, the United Nations Decade of Ocean Science for Sustainable Development, and the United Nations Decade on Ecosystem Restoration. Therefore, it is critical to link sci entific knowledge with technological development and coordinate the ef forts of academy institutions, business, and government to develop proofs of concept, scaling up, appropriation, and development of eco-efficient and sus tainable prototypes for animal protein production.Theareas that need to be strength ened are research and technological development, but they should be pri oritized based on three criteria:
3. Socioeconomic impact. Projections of expected benefits and impacts, both economic and noneconomic. Are the results generally applicable or almost exclusively fo cused on the project? What is the rel ative return on the investment made to bridge a Prioritiesgap?should be established with respect to the major goals of the area, focusing on improving aquacul ture technical competitiveness, en abling a long-term vision, coordina tion among private, state, and federal sectors, and research and infrastruc tureThisefforts.barrier can be addressed through strategic planning and co ordination among relevant agencies. Strategic planning can be used to obtain funding in desired areas and increase the likelihood of success in leveraging competitive funding op portunities.
Research is generally conducted largely through a fragmented matrix of short-term grant programs. Although a long-term increase in funding lev els can improve the competitiveness of aquaculture, more efficient use of existing funds and limited portfolios to address practical problems relevant to the development of commercial aquaculture is also needed.
Marco Linne Unzueta Associate Editor
»4 JUNE - JULY 2022


A process that has started three years ago The SPF certification process started around three years ago and during this period GenoMar´s facilities and fish populations were frequently au dited. Samples from the fish were col lected and analyzed by PCR following the guidelines set by the World Orga nization for Animal Health (founded as OIE) to meet the standards for disease-freedom certification.
The disease-free status covers the most significant viral pathogens in tilapia aquaculture worldwide: TiLV (Tilapia Lake Virus disease), VER (Viral Encephalopathy and Retinopa thy, also known as VNN) and Mega locytovirus (Iridoviral disease).
The Bureau of Fisheries and Aquatic Resources (BFAR) of the Republic of Philippines has granted the world´s first Specific Pathogen Free (SPF) certification to a tilapia producer. The facility subject to cer tification is the GenoMar’s nucleus and grandparent site located at the Central Luzon State University in the Philippines where the company has been operating a tilapia breeding pro gram since 1999.
The genetically improved fish populations reared in the mentioned facility represent the hub for further multiplication and distribution to other tilapia farms in Asia and Latin America.
Thanks to the GenoMar’s SPF certification the companies and countries importing genetic material from this facility are in good health and have low risk of transferring these pathogens. GenoMar’s bios ecurity and surveillance program and facilities will also be regularly audited going forward by the independent BFAR´s Aquatic Veterinary Services to maintain the SPF certification.
“Maintaining the highest level of ti lapia health, welfare and biosecurity is a foremost priority for GenoMar and is an integrated part of our strategy”, said Thea Luz G. Pineda, GenoMar’s Breeding Manager for Asia Pacific.
Rigorous biosecurity and health management principles From the company assured that this certification is a recognition of Ge noMar’s rigorous biosecurity and health management principles main tained over the years, and it is a great complement to the commercial value proposition of health-related prod ucts such as the Specific Pathogen Tolerant stocks GenoMar Strong.
GenoMar receives in Philippines the world´s first Specific Pathogen Free certification
»6 JUNE - JULY 2022 INDUSTRY NEWS
State delegation from Malaysia and visit to Vietnam On another subject, GenoMar Ge netics has reported that some days ago a state delegation from Malaysia visited the company facilities at the head office in Oslo, Norway. There, a memorandum of understanding to support the aquaculture develop ment in the Pahang state, Malaysia was sign. From the company, they say: “Thanks for the interest in our contribution of tilapia genetics to the aquaculture industry”. With this news, GenoMar’s strong activity in the Asian region becomes more than evident. But as if that were not enough, the announcements of the company’s work in the Philip pines and Malaysia adds to a recent visit to ThisVietnam.time,Tola Alvarez have vis ited for first time the operations, team and customers of their new subsidiary GenoMar Genetics Viet nam. There, “the team lead by Trung Nguyen Van have been able to build a fantastic hatchery operation, develop a highly committed and intellectually curious team and build brand recog nition for our products in the market in record time and in the middle of a pandemic situation”, he assured.
“We are extremely proud of this achievement and want to congratu late all our old and existing colleagues for having secured an excellent health status on this iconic facility over the years”, said Alejandro Tola Alvarez, CEO of GenoMar Group.
Is useful to remember that Ge noMar Genetics Group is an inter national aquaculture breeding and distribution company focusing on the global tilapia markets. From their breeding centers in Norway, Asia, and Latin America, they manage in novation and technology programs for some of the most recognized independent brands in the indus try such as GenoMar, Aquabel and AquaAmerica.“Ourexpanding production in frastructure enables to quickly dis seminate genetic progress and supply year-round, high-quality stocks to our clients contributing to a sustainable and profitable tilapia industry,” they say.
Blue Aqua International is a onestop solution provider for the aqua culture industry worldwide. The group provides cutting-edge solu tions for the management of the culture environment and the optimi zation of animal nutrition. Special ized in aquaculture technology and farming –the group transfers its ex pert solutions to over 4,000 custom ers worldwide and operates farms in Singapore and Indonesia. For more information. A library of free knowledge
» 7JUNE - JULY 2022
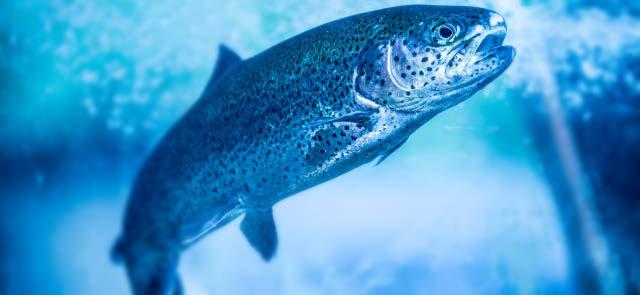
A country that imports 90% of its nutritional needs Blue Aqua announced plans earlier this year to build Singapore’s first high-tech fish farm for producing Trout. The intended project will in corporate super-intensive technol ogy to help achieve sustainable trout production locally to support Sin gapore’s food security initiatives, by making available fresh daily harvest of its premium quality rainbow trout. Land-scarce Singapore currently imports 90% of its nutritional needs, and is heavily dependent on Malay sia and Indonesia for its seafood im ports. The Group is also expanding its farming operations into Oman under the entity Blue Aqua Interna tional Gulf LLC. Singapore’s largest land-based shrimp farm It’s important to know that Blue Aqua is in discussion with other prominent funds in Europe and Southeast Asia to join this round of funding. The international company currently op erates Singapore’s largest land-based shrimp farm using its patented green technology for urban farming, con tributing to Singapore’s ‘Green Plan 2030’ sustainability ecosystem.
Muscat Investment House is one of the largest and most prominent business conglomerates in the Sultan ate of Oman, with more than twenty diversified subsidiaries throughout Oman and the Gulf. This is their first investment in the region, with the group’s moving focus into the sus tainable aquaculture sector.
Also, the company is the creator of Doctor Shrimp, a global shrimp farming community, a clearinghouse for technical and practical knowl edge on the five species of shrimp , L. vannamei , P. monodon , P. indicus , L. stylirostris and M. japonicus . “We be lieve passionately in the power of ideas to innovate, increase produc tivity and operate sustainably. On doctorshrimp.com, we’re building a library of free knowledge from the industry’s most advocated scientists, aquaculturists, and technical experts — along with a community of farm ers to connect both online and at events across the globe. With the Doctor Shrimp Clinic and Academy, they not only offer disease diagnostics services but also solutions, protocols and practical skills training for shrimp farming, they explain. From the Sultanate of Oman
Blue Aqua International, a global leader in shrimp aquaculture tech nology, announced an investment of SGD 8.8 million from Muscat Invest ment House in its subsidiary, Blue Aqua Singapore –the farming arm under the group. The investment will help boost Blue Aqua Singapore’s expansion to grow its operations in high-tech trout farming, ramping up distribution, and aquafeed manufac turing; in support of Singapore’s ‘30 by 30’ food security initiative.
Blue Aqua’s Farming Arm receives funding from Muscat Investment House to accelerate expansion of its trout farming in Singapore
The Muscat Investment House expressed its satisfaction, “We are pleased to join Blue Aqua on its mis sion to expand its scope of work and enable it to expand its aquaculture business in Singapore. This invest ment will be of mutual benefit to both companies and projects in Sin gapore and the Sultanate of Oman.”
In the other hand, founded in 1992, Muscat Investment House has expanded over the past three decades to become one of the larg est and most prominent business conglomerates in the Sultanate of Oman. Renowned for its distinctive creative vision and its community development, MIH acts as a flagship company orchestrating more than twenty diversified, high-powered subsidiaries throughout Oman and the Gulf. MIH Oman has developed specialized financial competencies to meet the growing need for ex perienced, discerning investment throughout the Sultanate.
The issue of the fuel prices
Is important to remember that each Member State have prepares a Part nership Agreement in cooperation with the European Commission (EC). This is a strategic document for programming investments from the cohesion policy funds and the EM FAF during the Multiannual Financial Framework. It focuses on EU priori ties, laying down the strategy and in vestment priorities identified by the Member State. It also presents a list of national and regional programs for implementation on the ground, as well as the indicative annual financial allocation for each program. Until now, the CE has signed Partnership Agreement for the 20212027 funding period with Denmark, Greece, Germany, Lithuania, Austria, Finland, France, Czechia, Sweden and Italy, among others. All the countries that have signed the Agreement will dedicate millions of its EMFAF to improve resource efficiency and com petitiveness of SMEs in the aquacul ture sector and in the protection and restoration of biodiversity, through innovation and development of selec tive fishing gear and river restoration. Fisheries and aquaculture industries are part of the green transition.
INDUSTRY NEWS
The European Maritime and Fisher ies Fund (EMFF), according to the text adopted by MEPs, would sup port companies whose fishing op erations have been jeopardized by the war, and fisheries and aquacul ture producer organizations and op
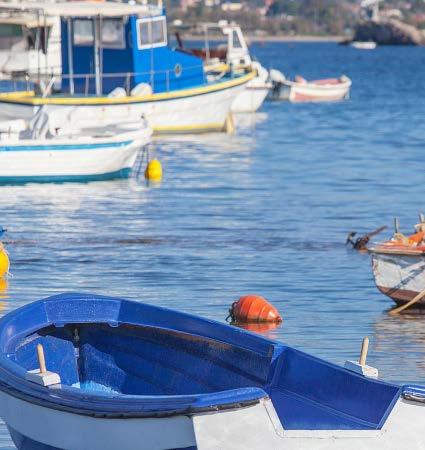
In useful to know that in 2019, the EU fishing fleet totaled 73,983 ves sels, providing direct employment to 129,540 fishers. Aquaculture employs around 75,000 people, with the pro cessing industry comprising around 3,500 companies. Fuel prices are pre venting fishing operators from break ing even and the scarcity of marine fuel keeps many vessels in port. Fur thermore, there is a lack of sufficient alternatives for species such as Alaska pollack and Russian cod and the lack of vegetable oil is causing serious dif ficulties for the canning industry.
»8 JUNE - JULY 2022
The members of the European Parliament (EP) in the Fisheries Committee adopted their position on a Commission proposal to finan cially compensate European Union (UE) fisheries and aquaculture hit by Russia’s war in Ukraine, unanimously with 24 votes. There will be aid to compensate for lost income and ad ditional expenses resulting from the war.This draft negotiating position should be submitted to the plenary vote in July. Once Parliament as a whole has approved it, MEPs will be ready to start talks with EU gov ernments on the final shape of the legislation.Following the vote, EP rapporteur Nuno Melo (European People’s Party, Christian Democrats, EPP, PT) said: “The report calls for specific mea sures to alleviate the market disruption to the seafood supply chain caused by the Russian aggression. The EU must take urgent action to mitigate the im pact of the war, and ensure the sur vival of companies and jobs in the fisheries and aquaculture sectors.”
Multiannual Financial Framework
EU governments would be able to use their remaining European Mari time and Fisheries Fund (EMFF) resources for the 2014-20 program ming period to address the war con sequences in the fisheries and aqua culture sector. Schemes to provide state aid MEPs amended the proposal to ex tend the compensation also to those companies whose economic viability has been impacted by the conflict and to the processing sector. 75% of cofinancing from the Fund would cover their lost income and additional costs caused by disruption to supply chains after the start of the war on 24 Feb ruary 2022. Besides financial compensation, member states would also be allowed to use the state aid rules more flex ibly. This would enable them to set up schemes to provide state aid to fisheries and aquaculture companies affected by the crisis.
Economic viability is threatened
erators whose economic viability is threatened due to market and supply chain problems caused by the Rus sian military aggression. These include a rise in the price of energy, raw materials and fish feed.
The members of the European Parliament endorse alleviating consequences of war for EU aquaculture and fisheries

“Over recent decades the prob lem has been oversupply, with a ma jor part of economic policy by gov ernments in the United States and Europe to curtail the production of food and to get farmers not to grow,” he said, adding: “We have the capac ity to produce much more.”
“There are also going to be im portant changes in what we con sume. We see the trends. My stu dents, for example, are increasingly moving from meat to fish, to veg etarian and to vegan,” he said.
That said, Stiglitz remains “very optimistic” for the longer-term fu ture of food, not least because of the great advances in science and technology. “We’ve seen it with re newable energy, and we are going to see it in food production with im proved efficiencies”.
Changes in what we consume “Historically, food shortages and high prices have led to increased volatility and political unrest. And at this moment in time, with these kinds of food price increases com ing on top of the pandemic, we can expect an even more turbulent time than we have just gone through in the last two years.”
» 9JUNE - JULY 2022
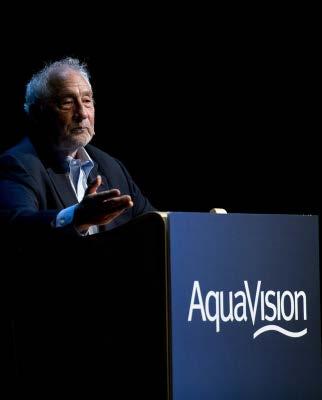
2022: Professor Joseph Stiglitz remained “very optimistic” for the longer-term future of food because of the great advances in science and technology limits. “Over the years we have be come more and more aware of those planetary boundaries. We have to learn to live with and respect them,” he said. “We have the capacity to produce much more” Recognizing that while society is in the midst of an unprecedented pe riod of turbulence, with the covid pandemic being quickly followed by the ongoing conflict in Ukraine, and markets everywhere experiencing very high food prices as a direct re sult, Stiglitz believes there shouldn’t be any problems regarding the actual supply of foodstuffs.
Delivering the Keynote Address at the 14th AquaVision, the global aquaculture business conference organized by Skretting and held in Stavanger, Norway, Nobel Prizewinning economist Professor Joseph Stiglitz, said that food is essential to human life and as a product, it must be provided to consumers in a stable and resilient way. Stiglitz remained “very optimistic” for the longer-term future of food, not least because of the great advances in science and technology.Butsome of the main sources of the global food supply have not lived up to this fundamental requirement, he pointed out. “We are entering a pe riod of increased complexity, where achieving that stability and resilience is going to be more difficult and so there needs to be a greater focus on risk management than may have been the case in the past.” Stiglitz added that with regards to sustainability and establishing re sponsible food production, there’s also now a much greater emphasis on operating within safe environmental
The issue of distribution At AquaVision 2022, Stiglitz also warned that there are serious prob lems with regard to distribution, as well as the form of food production and consumption. Whereas Europe and America have huge potential to produce more, Africa will have prob lems. Where food is and where peo ple have the capacity to pay for it is the issue, he said. According with Stiglitz, there’s also likely to be more market turmoil in the short term.
Stiglitz also maintained that not producing food sustainably would bring financial consequences, even in those instances where it comes with additional costs. “If we don’t com mit to being green there will be an effect on climate change and that will make food more expensive. Our so ciety is going to pay the cost one way or another – we need to take actions early and prevent what will happen if we don’t.”
Aquavision is organized for Skretting, a global leader in provid ing innovative and sustainable nutri tional solutions and services for the aquaculture industry. Skretting has production facilities in 19 countries on five continents and manufactures and delivers high-quality feeds from hatching to harvest for more than 60 species. The total annual produc tion volume of feed is more than 2 million tons. The head office is lo cated in Stavanger, Norway. Skret ting is the aquaculture business line of Nutreco, a world leader in animal nutrition.
Aquavision
»10 JUNE - JULY 2022
Significant growth in aquaculture has driven global fisheries and aqua culture production to a record high as aquatic foods make an increasingly critical contribution to food secu rity and nutrition in the 21st century, according to a report from the UN Food and Agriculture Organization (FAO) released a few days ago. The 2022 edition of ‘The State of World Fisheries and Aquaculture’ (SOFIA) says the growth of aquaculture, par ticularly in Asia, lifted total produc tion of fisheries and aquaculture to an all-time high of 214 million tones in 2020, comprising 178 million tons of aquatic animals and 36 million tons of Productionalgae. of aquatic animals in 2020 was 30%% higher than the aver age in the 2000s and more than 60% above the average in the 1990s. Re cord aquaculture output of 87.5 mil
‘’The growth of fisheries and aquaculture is vital in our efforts to end global hunger and malnutrition but further transformation is needed in the sector to address the challeng es,’’ says FAO Director General, QU Dongyu. ‘’We must transform agri food systems to ensure aquatic foods are sustainably harvested, livelihoods are safeguarded and aquatic habitats and biodiversity are protected.’’ Increased at an average annual rate of 3% since 1961 Aquatic foods are contributing more than ever before to food security and nutrition. Global consumption of aquatic foods (excluding algae) has increased at an average annual rate of 3% since 1961, almost twice that of annual world population growth – reaching 20.2 kg per capita, more than double the consumption in the 1960s.Over 157 million tons – or 89% of aquatic animal production, were used for direct human consumption in 2020, a slightly higher volume than in 2018, despite the impact of the COVID-19 pandemic. Aquatic foods contribute about 17% of the animal proteins consumed in 2019, reaching 23% in lower-middle-income coun tries and more than 50% in parts of Asia and Africa.
FAO’s report SOFIA says growth is driven by aquaculture lion tons of aquatic animals largely drove these outcomes.
As the sector continues to expand, FAO says more targeted transforma tive changes are needed to achieve a more sustainable, inclusive and equi table fisheries and aquaculture sector.
INDUSTRY NEWS
A ‘Blue Transformation’ in how we produce, manage, trade and consume aquatic foods, is crucial if we are to achieve the UN Sustainable Develop ment Goals.

Faster than capture fisheries
Aquaculture has grown faster than capture fisheries in the last two years and is expected to expand further over the next decade. In 2020, animal aquaculture production reached 87.5 million tons, 6% higher than in 2018. On the other hand, capture fisheries production dropped to 90.3 million tons, a fall of 4.0% compared with the average over the previous three years.
Asian countries were the source of 70% of the world’s fisheries and aquaculture production of aquatic an imals in 2020, followed by countries in the Americas, Europe, Africa and Oceania. China remained the top fish eries producer, followed by Indone sia, Peru, the Russian Federation, the United States, India and Viet Nam.
» 11Aquaculture MagazineJUNE - JULY 2022
The sustainability remains of significant concern FAO says more needs to be done to feed the world’s growing population while enhancing the sustainability of stocks and fragile ecosystems and protecting lives and livelihoods in the long-term. According to SOFIA 2022, the sustainability of marine fishery resources remains of significant con cern, with the percentage of sustain ably fished stocks falling to 64.6% in 2019, a 1.2% decline from 2017. However, there are encouraging signs as sustainably fished stocks pro vided 82.5% of the total volume of 2019 landings a 3.8% increase since 2017. This seems to indicate that larger stocks are being managed more effectively.FAOpromotes Blue Transforma tion, a visionary strategy to meet the twin challenges of food security and environmental sustainability while ensuring equitable outcomes and gender equality. Climate and environ ment-friendly policy and practices, as well as technological innovation, are also vital for change.
The reduction in capture fisheries production was mainly driven by the covid-19 pandemic, which severely disrupted fishing activities, market ac cess and sales, as well as a reduction in China’s catches and a fall in the natu rally-fluctuating anchoveta catches.
Total production of aquatic ani mals is expected to reach 202 million tons in 2030, mainly due to the con tinuing growth of aquaculture, pro jected to reach 100 million tons for the first time in 2027 and 106 million tons in 2030.
Growing demand for fish and other aquatic foods is rapidly chang ing the fisheries and aquaculture sector. Consumption is expected to increase by 15% to supply on aver age 21.4 kg per capita in 2030, driven mostly by rising incomes and ur banization, changes in post-harvest practices and distribution, as well as in dietary trends focusing on better health and nutrition.
‘’Blue Transformation is an ob jective-driven process through which FAO Members and partners can maximize the contribution of aquatic food systems to enhance food secu rity, nutrition and affordable healthy diets, while remaining whithin eco logical boundaries,’’ says Manuel Ba range, Director of FAO’s Fisheries and Aquaculture Division. Fisheries and aquaculture contrib ute to employment, trade and eco nomic development. The total first sale value of fisheries and aquacul ture production of aquatic animals in 2020 was estimated at $406 billion, of which $265 billion came from aqua culture production.
n the first quarter of this year, FAO presented the biennial re port “SOFIA 2022” with the analysis and relevant conclusions of the information collected in 2020. In general, it can be summarized that aquaculture continues to grow at a slower rate than in previous years, due to increased control of production in China for environmental reasons. The growth rate decreased from an average of 4.4% per year from 2010 to 2018 to 3.3% in 2018 - 2019 and 2.6% in 2019 - 2022. For its part, fisheries continue to decline, due in part to the influence of negative impacts such as overfish ing, pollution of seas, oceans, rivers and lagoons, and the effects of climate change.Global seafood consumption continues to increase, despite a slight decline in 2020 due to the By: Aquaculture Magazine Editorial Team*
In the first quarter of this year, FAO presented the biennial report “SOFIA 2022” with the analysis and relevant conclusions of the information collected in 2020. In this article, Aquaculture Magazine editors summarize the “key messages” the World Agency is sending with this report.
I
»12 JUNE - JULY 2022
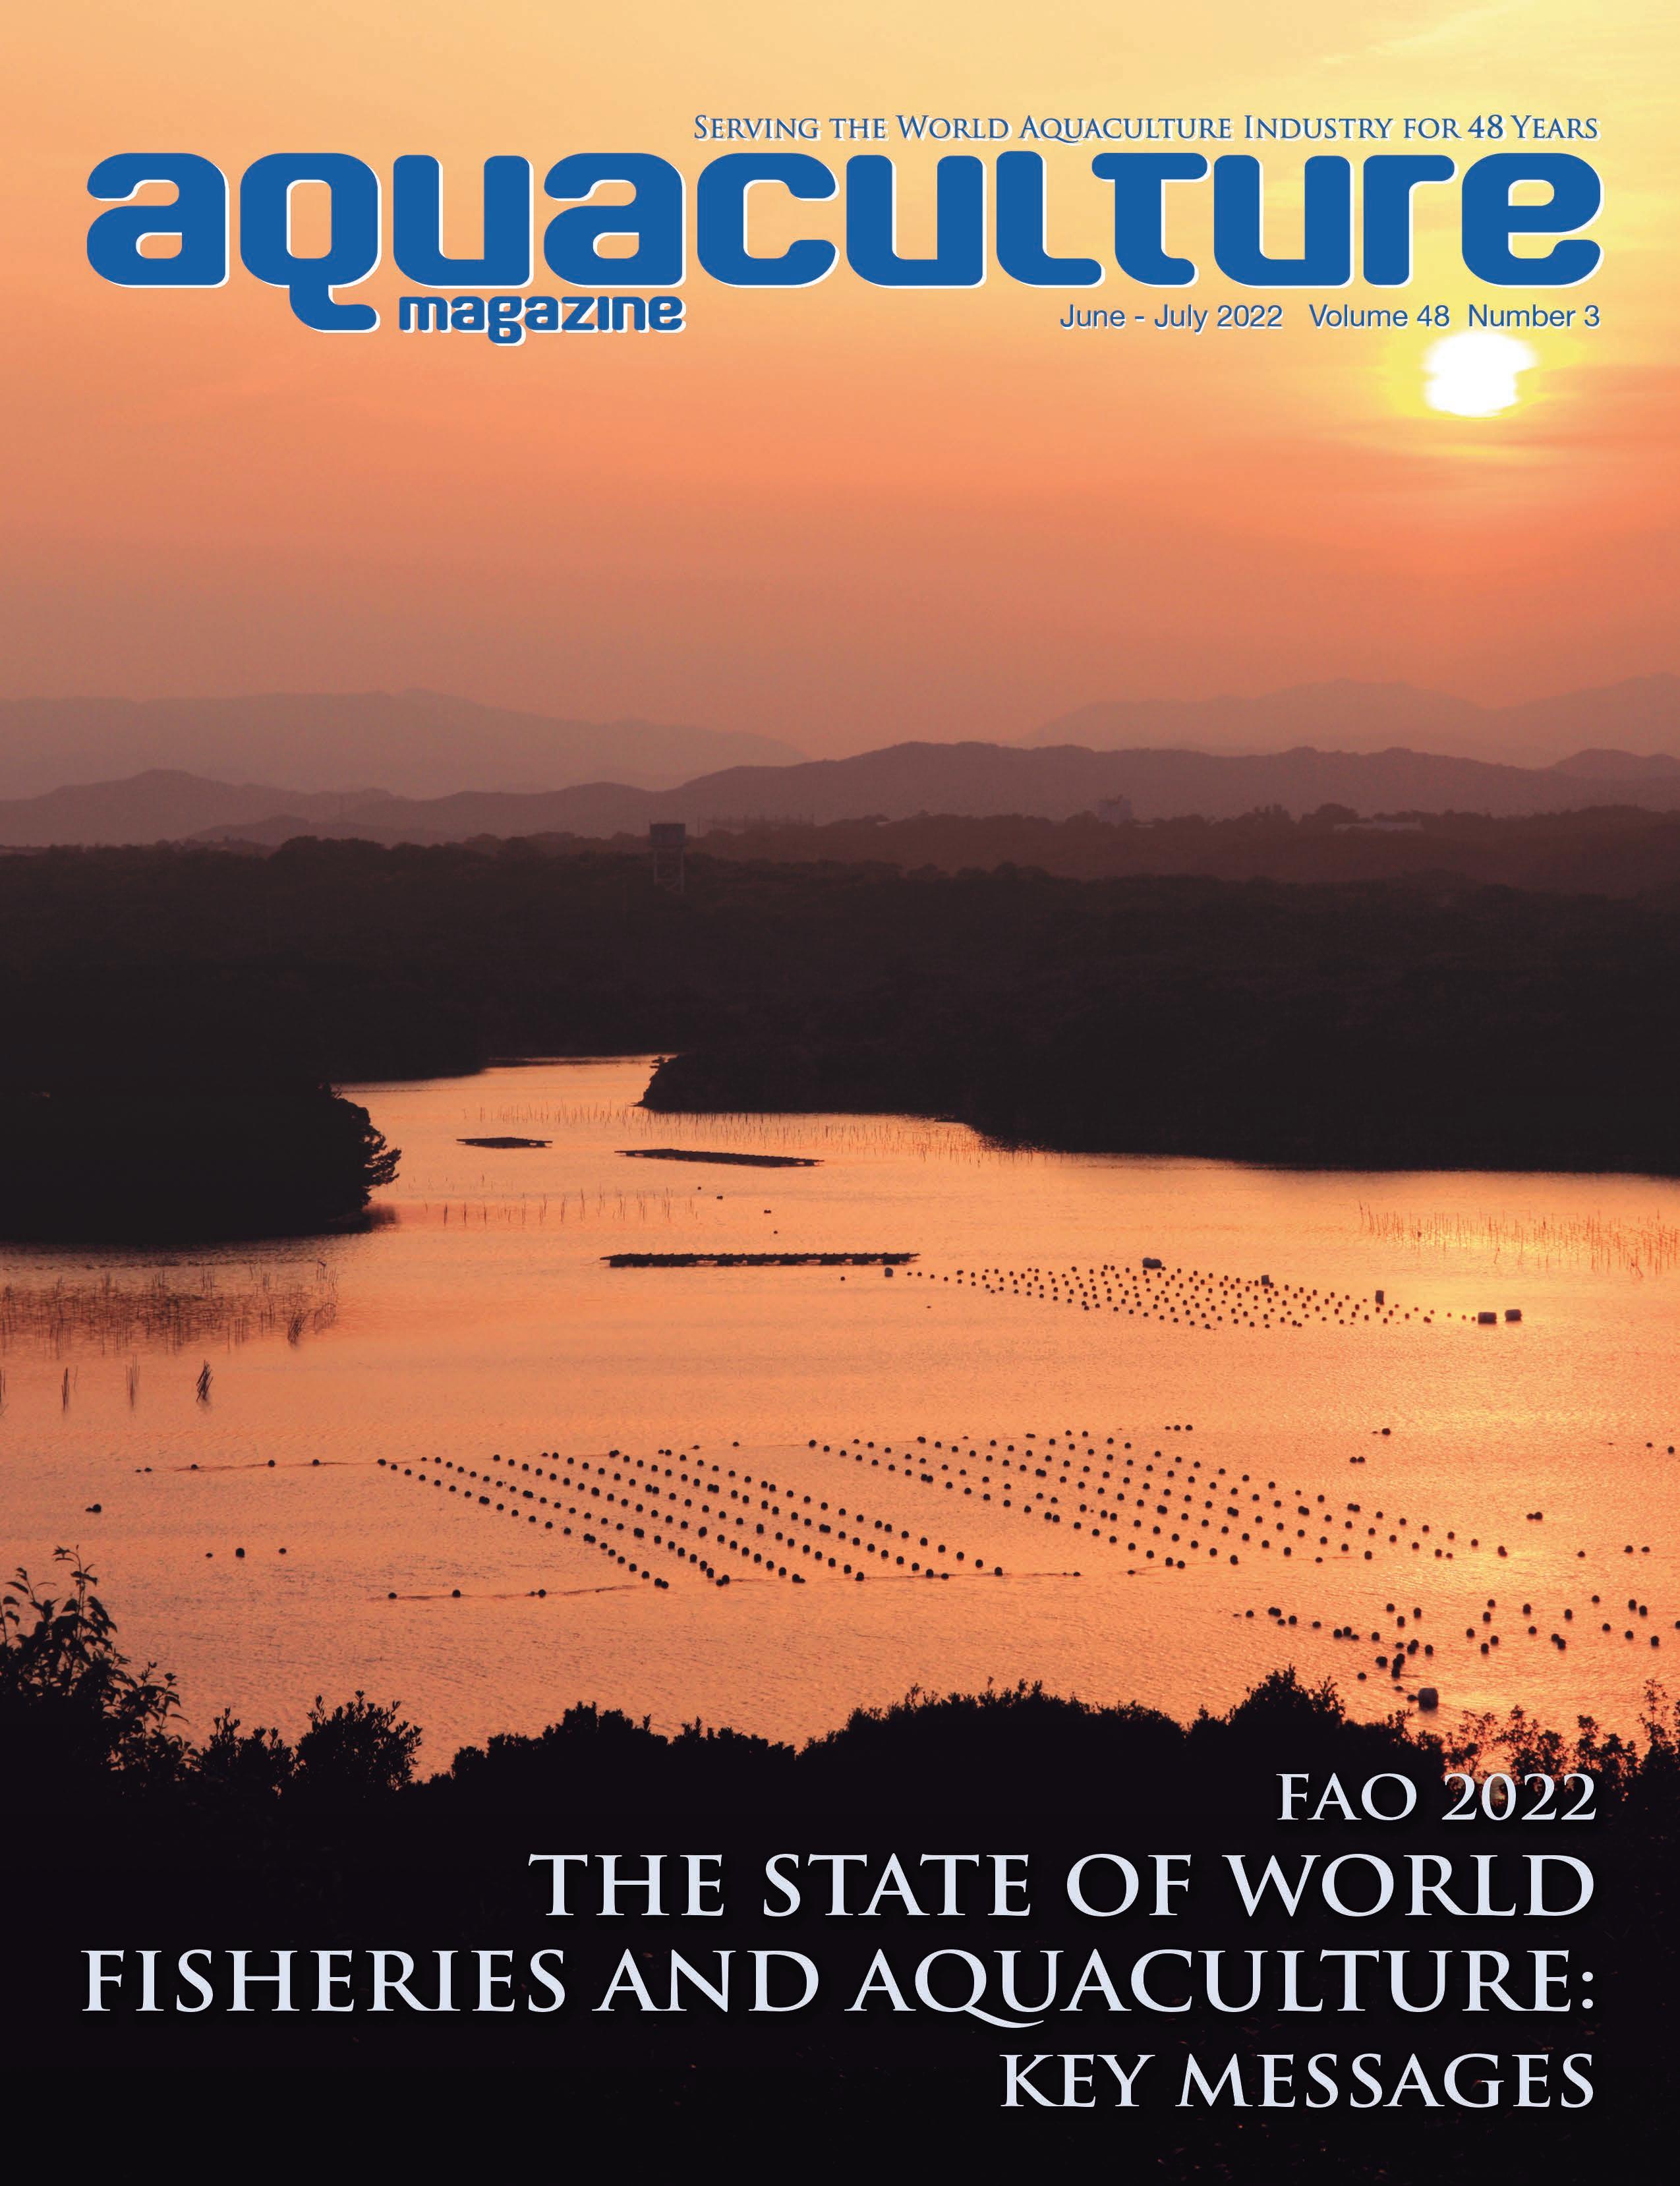
ARTICLE FAO THE2022STATE OF FISHERIESWORLD KEYAQUACULTURE:ANDMESSAGES
COVID -19 pandemic, with average per capita consumption expected to reach 21.4 kg in 2030. A slow growth considering that the average per capita consumption in 2019 was 20.5, which is considered a histori cal record. This decrease represents a growth of 1.3% over the next ten years, or an average of 0.13% per year. In this article, Aquaculture Mag azine editors summarize the “key messages” the World Agency is sending with this report. Global fisheries and aquaculture production is at a record high, and the sector will play an increasingly important role in providing food and nutrition in the future. Total fisheries and aquaculture pro duction will reach a record 214 mil lion metric tonnes in 2020, including 178 million metric tonnes of aquatic animals and 36 million metric tonnes of algae, largely due to the growth of aquaculture, particularly in Asia. The amount intended for human consumption (excluding seaweed) was 20.2 kg per capita, more than double the average of 9.9 kg per capita in the 1960s. An estimated 58.5 million people were employed in the primary sec tor, including those employed in the subsistence and secondary sectors and their dependents, an estimated 600 million people depend at least partially on fisheries and aquacul ture. International trade in fisheries and aquaculture products generated about $151 billion in 2020, a decline from the record high of $165 billion in 2018, largely due to the outbreak of COVID-19.
growth has often come at the expense of the environ ment. Developing sustainable aqua culture remains critical to meet the growing demand for aquatic food.
Developingaquaculturesustainable remains critical to meet the growing demand for aquatic food.
» 13JUNE - JULY 2022
Per capita consumption of aquatic foods increased from an average of 9.9 kg in the 1960s to a record high of 20.5 kg in 2019, while declining slightly to 20.2 kg in 2020. Rising incomes and urbanization, improve ments in postharvest practices, and changing dietary trends are projected to increase aquatic food consump tion by 15%, resulting in an average of 21.4 kg per capita in 2030. Fishery resources continue to decline due to overfishing, pollution, poor management, and other factors, but landings from biologically sustainable stocks are increasing. The proportion of fishery stocks that are within biologically sustainable lev els declined to 64.6% in 2019, down 1.2% from 2017; however, 82.5% of landings in 2019 came from biologi cally sustainable stocks, a 3.8% im provement over 2017. Effective fisheries management has been shown to rebuild stocks and increase catches within ecosystem boundaries. Improving global fisher ies management remains critical to restoring ecosystems to a healthy and productive state and ensuring longterm aquatic food supplies. Rebuild ing overfished stocks could increase fisheries production by 16.5 million
Global consumption of aquatic foods has increased significantly in recent years and will continue to increase. Global consumption of aquatic foods (excluding algae) has increased at an average annual rate of 3.0% since 1961, compared with a popula tion growth rate of 1.6%.
Aquaculture has great potential to feed and sustain the world’s growing population. But growth must be sustainable. In 2020, global aquaculture produc tion reached a record 122.6 million metric tonnes with a total value of USD 281.5 billion. Aquatic animals accounted for 87.5 million tonnes and algae 35.1 million toness. In 2020, driven by expansion in Chile, China and Norway, global aqua culture production grew in all regions except Africa, where it increased in the top two producing countries, Egypt, and Nigeria. The rest of Afri ca saw growth of 14.5% in 2019, and Asia continues to dominate global aquaculture, accounting for 91.6% of totalAquacultureproduction.
Aquatic animal production is projected to grow another 14 percent by 2030. It is critical that this growth goes hand in hand with protecting ecosystems, reducing pollution, protecting biodi versity, and ensuring social equity.
Total aquatic animal produc tion is projected to reach 202 million metric tonnes in 2030, thanks largely to continued growth in aquaculture, which is expected to reach 100 mil lion metric tonnes for the first time in 2027 and 106 million metric tonnes in 2030.Global capture fisheries are pro jected to recover and increase 6% from 2020 to 96 million metric tonnes in 2030, driven by improved resource management, underfished stocks, and reduced discards, waste, and losses.
Reductions in the global fishing fleet continue, but more needs to be done to minimize overcapacity and ensure fisheries sustainability.
The FAO forecast for fisheries and aquaculture up to 2030 assumes an in crease in production, consumption, and trade, albeit at slower growth rates.
ARTICLE
»14 JUNE - JULY 2022 metric tonnes and increase the con tribution of marine fisheries to food security, nutrition, economic growth, and the well-being of coastal com munities.
Millions of people depend on aquatic food systems for their livelihoods. But many small-scale producers, especially women, are vulnerable to precarious working conditions. Building their resilience is key to sustainability and equitable development.
Although women play a critical role in fisheries and aquaculture, they make up a disproportionate share of workers in the informal, lowest-paid, least stable, and least skilled segments of the labour force and often face gender-based con straints that prevent them from fully realising and benefiting from their role in the sector.
Of the 58.5 million people who will be employed in the primary fisheries and aquaculture sector in 2020, 21% will be women, rising to about 50% of those employed throughout the aquatic value chain (including preand post-harvest).
The total number of fishing vessels in 2020 was estimated at 4.1 million, a 10% decrease since 2015, reflecting efforts by countries, particularly Chi na and European countries, to reduce global fleet size. Asia still had the largest fishing fleet, accounting for about two-thirds of the total global fleet. However, fleet size reduction alone does not necessarily guarantee more sustain able outcomes, as changes in fishing efficiency can offset sustainability gains from fleet reduction.

The Blue Transformation aims to promote sustainable expansion and intensification of aquaculture, effective management of all fisheries, and enhancement of aquatic value chains.
The Blue Transformation requires the commitment of the public and private sectors if we are to achieve the United Nations Agenda. United Nations 2030 Agenda, espe cially as the COVID-19 pandemic has reversed previously favourable trends. The Blue Transformation re quires a commitment from govern ments, the private sector, and civil society to maximise the opportuni ties that fisheries and aquaculture offer.The Blue Transformation aims to promote sustainable expansion and intensification of aquaculture, ef fective management of all fisheries, and enhancement of aquatic value chains. Proactive public and private partnerships are needed to improve production, reduce food loss, and waste, and increase equitable access to lucrative markets.
References and sources consulted by the autor on the elaboration of this article are available under previous request to our editorial staff. Consequently, aquatic foods need to be included in national food secu rity and nutrition strategies, and ini tiatives are needed to raise consumer awareness of their benefits to im prove availability and access.
» 15JUNE - JULY 2022
Aquatic food systems are an effective solution. The Blue Transformation can address the twin challenges of food security and environmental sustainability.
FAO is committed to the Blue Trans formation, a visionary strategy that aims to strengthen the role of aquatic food systems in feeding the world’s growing population by creating the legal, policy and technical frame works needed for sustainable growth andTheinnovation.BlueTransformation pro poses a series of actions to promote the resilience of aquatic food systems and ensure that fisheries and aquacul ture grow sustainably and leave no one behind, especially communities that depend on the sector. Climate and environmentally friendly policies and practices, as well as technologi cal innovations, are critical building blocks for the Blue Transformation.
By: Aquaculture Magazine Editorial Team*
»16 JUNE - JULY 2022 ARTICLE
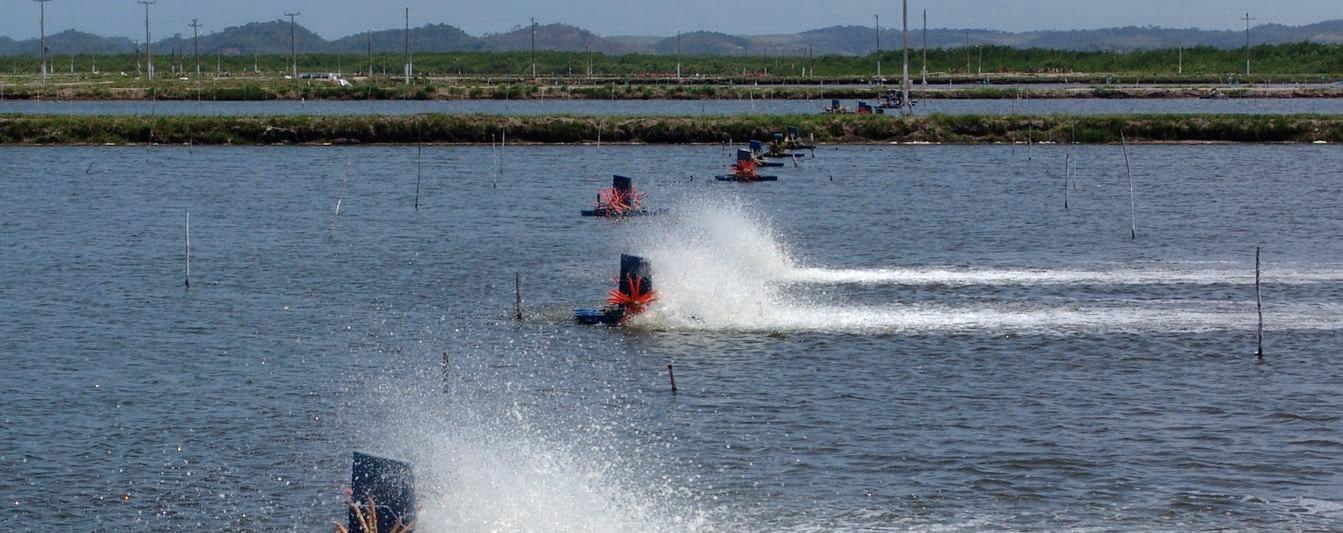
Economic feasibility study of aerators in aquaculture using life cycle costing (LCC) approach
The selected aerator for aquaculture operations must be economically efficient and should be able to fulfil the requirement of oxygen supply in the pond water. Here we present a study of economic feasibility of nine different types of aerators using life cycle costing (LCC) approach. The recommended option can be implemented for any types of cultured species at any prevailing environmental conditions.
The aquaculture sector plays a vital role in meeting food and nutritional demand worldwide. To meet the growing demand, fish farmers are in creasing production by adopting semi intensive and intensive aquaculture system. At high stocking density, dis solved oxygen (DO) is probably the second most important input next to feed regulating the production of fish. Therefore, it is essential to sup ply DO through artificial aeration in these types of culture systems. Hence, the continuous supply of oxygen for maintaining the adequate DO con centration to the aquaculture ponds has become prerequisite for healthy growth and survival of aquatic species. Aerators can induce circulation of water, supply of DO, remove small or large size particles and improve bottom mud conditions. But, the knowledge of efficient utilization of aerators to contribute to sustainable production systems is poorly under stood. Many farmers operate the aer ators without knowing its suitability of use and efficiency. Such empirical practices may not be very beneficial to farmers because the management expense of aerators may be prohibi tive. Therefore, systematic operation of the aerator with proper knowledge is required from both economic and environmental points of view. It’s es sential to create research possibilities to reduce the energy usage of aera tion in Thisaquaculture.articlepresent a study con ducted to evaluate the economics of different existing aerators. The capi
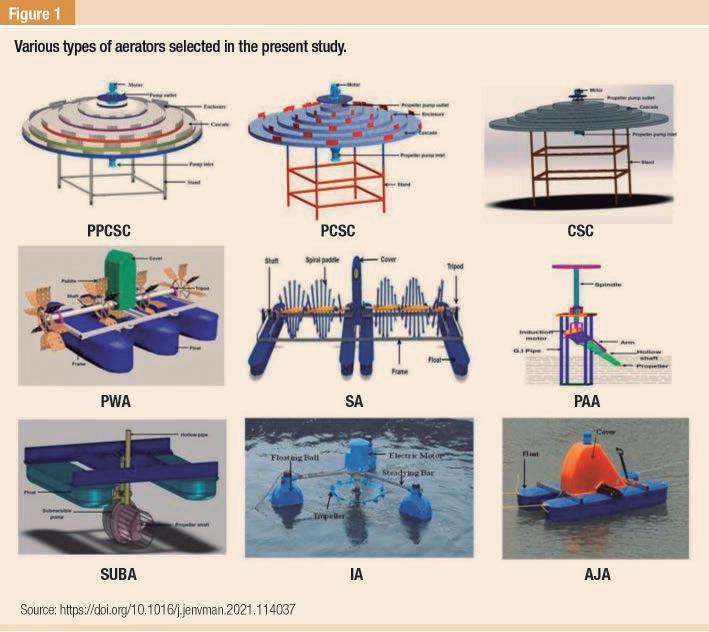
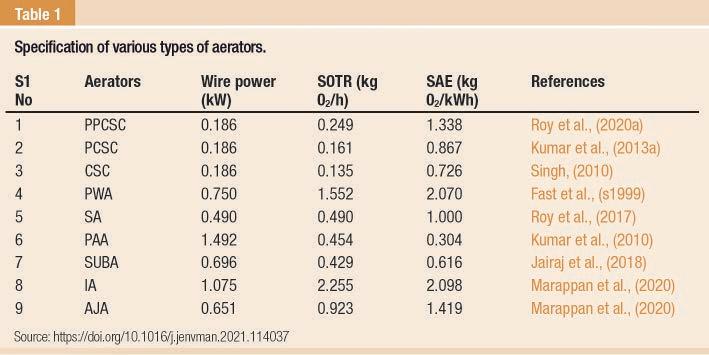
Cc= C0+CR+CM+CE where, C0 is the product capital cost, CR is the capitalized replace ment cost, CM is the capitalized maintenance cost, and CE is the capitalized energy cost. The capital ized cost of various alternatives can be calculated using the above equa tions and the optimal configuration will be the one with the least capital ized cost. Following the method as described and assuming capital cost includes the cost of required aera tors and standby aerators as a factor of safety, the capitalized cost of the aerators was also calculated. Aeration characteristics of various aerators Different types of aerators are being used in aquaculture operations. The aerators in general can be classified under three categories – (i) Splash Aerator, (ii) Diffused-air Aerator and (iii) Gravity Aerator. In the present study, nine different types of available aerators: (i) perfo rated pooled circular stepped cascade (PPCSC); (ii) pooled circular stepped cascade (PCSC); (iii) circular stepped cascade (CSC); (iv) paddle wheel (PWA); (v) spiral aerator (SA); (vi) propeller aspirator pump (PAA); (vii) submersible aerator (SUBA), (viii) impeller aerator (IA) and (ix) air-jet aerator (AJA) (Figure 1) were consid ered. The aeration characteristics of the aerators are reported in Table 1. The selected aerator for aquaculture operations must be supplyrequirementefficienteconomicallyandshouldbeabletofulfiltheofoxygeninthepondwater.
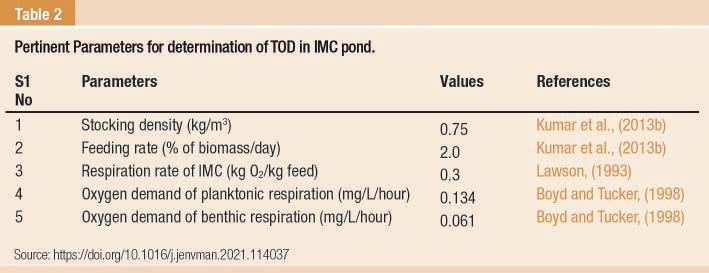
» 17JUNE - JULY 2022 talization method, a LCC approach, was used for comparing the econom ics among different aerators. In this method, the total capitalized cost is determined by adding the capital cost of the aerator with the capitalized values of replacement cost, mainte nance cost, and the energy cost. A typical Indian major carp (IMC) cul ture is considered in this study and based on the oxygen demand posed by the IMC, phytoplankton’s, ben thos, the capitalized cost of nine dif ferent aerators were found out for different conditions (initial DO levels and pond volumes) and the aerator with the least capitalized cost was rec ommended for each condition. Materials and methods Life cycle costing approach Life cycle costing (LCC) is an eco nomic analysis technique to evaluate the total cost of a system over its life span or over the period a service is provided. In this technique, two costs are considered – (i) capital cost and (ii) recurring cost. Thus will be the summation of capital cost, re placement cost for the product, capi talized maintenance cost and capital ized energy cost and is represented as follows.
Economic comparison was eventual ly made among the different aerators based on the total capitalized cost. Fi nally, the optimal type of aerator was recommended based on the values of CP and pond water volumes. Results Capitalized cost of different aerators
Standard aeration efficiency (SAE) is a better comparative performance parameter than SOTR (Lawson and Merry, 1993) which is defined as the standard oxygen-transfer rate (SOTR) per unit of power input to the aerator. Estimation of total oxygen demand (TOD) The total oxygen demand (TOD) in aquacultural pond depends on the cultured species as well as the quality of water. In the present study stan dard culture of Indian Major Carps (IMC), namely, catla (Catla catla), rohu (Labeo rohita) and mrigal (Cirrhinus mrigala) was considered with a ratio of 4:3:3. The different culture param eters are presented in Table 2. Pond conditions AE and the number of aerators re quired directly depend on the water quality conditions which mainly in clude water temperature, T; α and β factors, initial DO concentration in pond water (CP) and pond water volumes. In the present study, typical values of temperature (T), α and β were chosen as 25 ºC, 0.95 and 0.90 respectively. The saturation dissolved oxygen concentration, Cs was consid ered as 8.26 mg/L at 25 ºC. CP (1, 2 and 3 mg/L) as well as the pond wa ter volumes (500, 1000, 2000, 3000, 5000, 8000 and 10,000 m3 with water depth as 1.0 m in each of the cases) were varied to evaluate the life cycle cost for different aerators.
ARTICLE Method for evaluation standard oxy gen transfer rate (SOTR) and standard aeration efficiency (SAE) of an aeration system
In order to evaluate the performance of an aerator, standard oxygen trans fer rate (SOTR) and standard aera tion efficiency (SAE) are generally used. These parameters are defined as follows:Thestandard oxygen transfers rate (SOTR) of an aeration system is de fined as the oxygen transfer per unit time to a water body under standard conditions.
»18 JUNE - JULY 2022
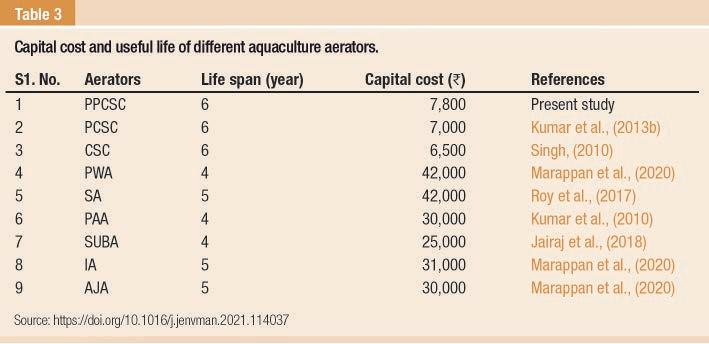
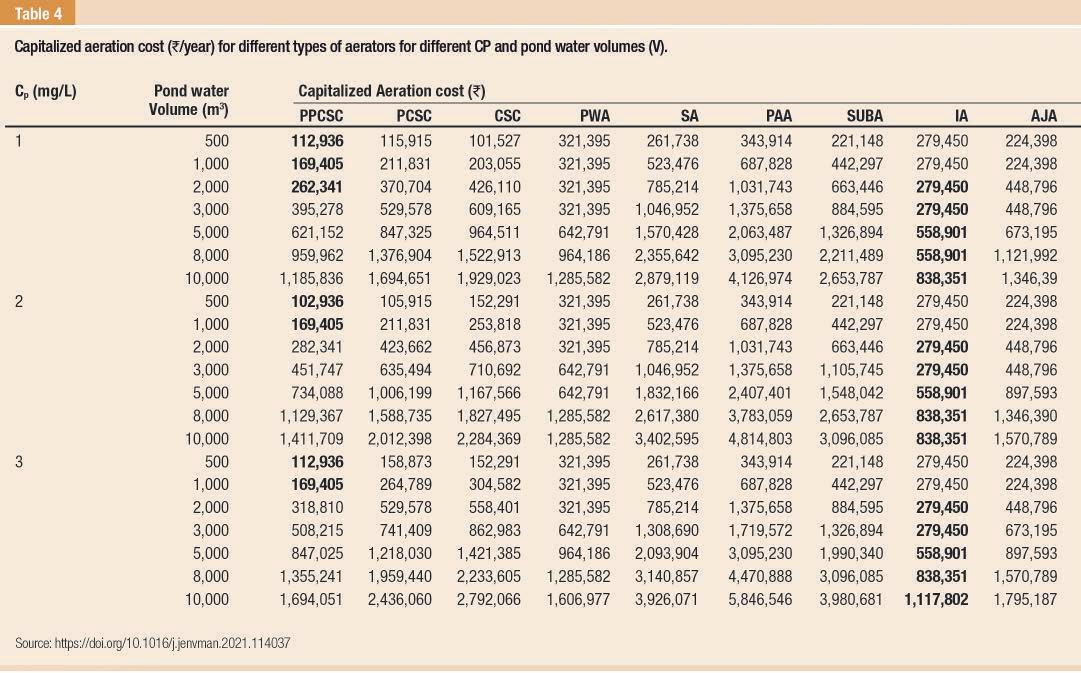
Estimation of total capitalized cost of aeration system (Cc) The values of capital cost and life span of the different aerators are pre sented in Table 3. The bank interest rate, maintenance fraction, salvage fraction, and standby fraction for the aerators were assumed to be 12%, 0.07, 0.10, and 0.75 respectively. The electricity rate was taken as Rs. 4.72/ kWh. Assuming the culture period to be of 190 days per year with 16 h of aeration time per day, the total annual hours of aeration was calculated to be 3,040 h. The capital cost, capitalized re placement cost, capitalized mainte nance cost, and capitalized energy cost were calculated assuming the bank interest rate, maintenance frac tion, salvage fraction, and standby fraction as mentioned above. The to tal capitalized cost of the nine differ ent types of aerators were then calcu lated using Equation (2) for different values of CP (1, 2, and 3 mg/L) and pond water volumes (500, 1000, 2000, 3000, 5000, 8000, and 10,000 m3).
For pond water volumes more than 2,100 m3, IA is the most suitable aerator followed by PWA, PPCSC and other aerators.
The capitalized cost of all the aera tors considered at different values of CP and pond water volumes are pre sented in Table 4. The aerator with the minimum capitalized cost at a par ticular CP and pond water volume is
» 19JUNE - JULY 2022 denoted in bold. It can be noted from the table that at pond water volumes of less than 2,000 m3, the minimum capitalized cost (Cc) is achievable with the PPCSC aerator, particularly at low values of CP (CP < 3 mg/L, critical condition in case of an inten sive aquacultural pond). However, at higher pond water volumes (more than 2,000 m3) and CP ≥ 3 mg/L, IA is the most preferred aerator.
The capitalized cost of aerators depends on various parameters like culture species, oxygen demand by cultured species, planktonic and ben thic species, stocking density, the environmental conditions of the pond water, including temperature, initial dissolved oxygen (CP), and pond water volumes (V).
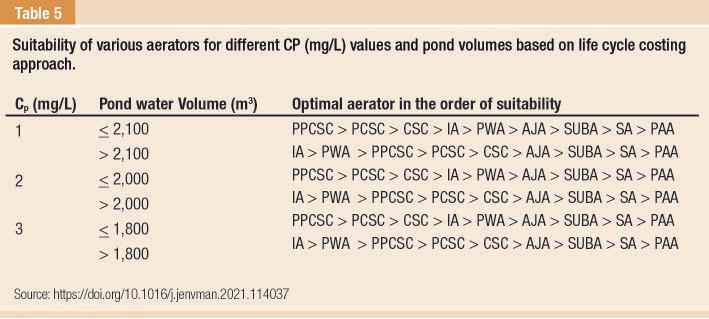
The suitability of various aerators for different CP (mg/L) values and pond water volumes (V) based on the minimum capitalized cost is presented in Table 5. It can be observed that, PPCSC aerator can be considered as the most suitable aerator (yielding the lowest capitalized cost), for the following combinations: (i) CP = 1 mg/L and V ≤ 2,100 m3, (ii) CP = 2 mg/L and V ≤ 2,800 m3 and (iii) CP = 3 mg/L and V ≤ 1,800 m3. Under oth er situations, mostly when pond wa ter volume (V) is more, IA proves to be the most suitable aerator followed by PWA, PPCSC and other available aerators.
Sensitivity analysis
It is important to note that in in tensive fish culture systems, it has become a common practice to adopt small pond sizes for proper manage ment of the culture system. In such culture ponds, PPCSC aerator will be the most preferred one in compari son with the other available aerators.
Apart from CP and V, two sig nificant parameters affecting the eco nomics of the aerators are stocking density of fish and the capital cost of the aerator as they have a direct im pact on the values of Cc for different aerators. In this analysis, only two best performing aerators – PPCSC and IA have been selected for comparison.
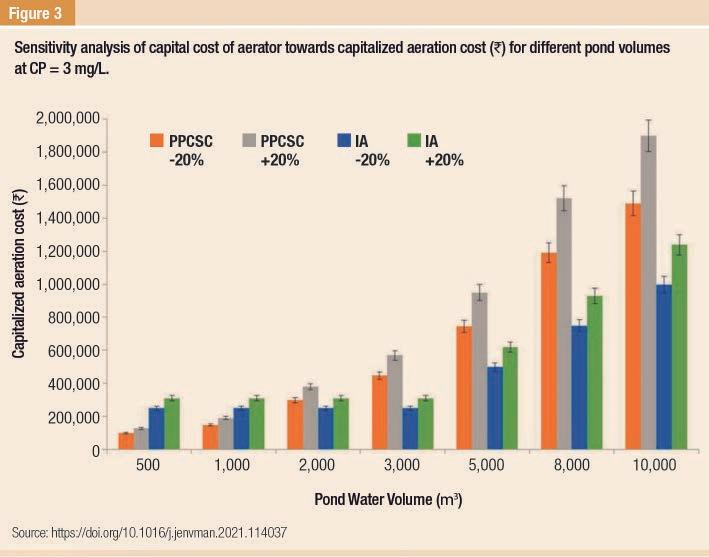
It can be clearly noticed from the figures that, PPCSC aerator performs better than IA up to V = 2,000 m3 . However, at higher values of V, eco nomic performance of IA is better. This life cycle costing approach for selection of aerators can very well be applied to any types of culture sys tems. However, the input parameters involving the culture of the specific aquatic species have to be modified, and the capitalized cost for all the aerators can be calculated and com pared accordingly.
Comparative economic analysis assuming a typical IMC culture re veals that (i) PPCSC aerator is economically the most efficient aerator when pond water volume is less than equal to 2,100 m3 and the pond dissolved oxy gen is critically low (less than equal to 3 mg/L).(ii)For pond water volumes more than 2,100 m3, IA is the most suitable aerator followed by PWA, PPCSC and other aerators.
(iii) The sensitivity analysis of the capital cost of the aerator and the stocking density on the capitalized cost of the aerators revealed that up to 2,000 m3 of pond water volume, PPCSC aerator is economically better than IA. However, for higher pond water volumes, IA performs the best on economical basis.
This is a summarized version developed by the editorial team of Aquaculture Magazine based on the review article titled “ECONOMIC FEASIBILITY STUDY OF AERATORS IN AQUACULTURE USING LIFE CYCLE COSTING (LCC) APPROACH” developed by SUBHA M. ROY, RAJENDRA MACHAVARAM and C.K. MUKHERJEE - Indian Institute of Technology Kharagpur, West Bengal, India; SANJIB MOULICK - School of Civil Engineering, Kalinga Institute of Industrial Technology (KIIT) Deemed to be University, Bhubaneswar, Odisha, India. The original article was published in JOURNAL OF ENVIRONMENTAL MANAGEMENT in NOVEMBER 2021. The full version, including tables and figures, can be accessed online through this https://doi.org/10.1016/j.jenvman.2021.114037link:
Conclusions
ARTICLE In order to evaluate the effect of stocking density of fish on Cc, a sensitivity analysis was performed for PPCSC and IA by varying the stocking density by ± 20% for differ ent pond water volumes (V) of 500, 1000, 2000, 3000, 5000, 8000, and 10,000 m3 and CP values (1, 2, and 3 mg/L). It can be concluded that when stocking density is decreased by 20%, PPCSC aerator is preferable with V less than equal to 2,000 m3 at all values of Cp. The results for CP =3 mg/L is shown in Figure 2. The variation of capitalized cost due to changes in capital cost (± 20%) of the aerators at different pond wa ter volumes for CP values of 1, 2, and 3 mg/L was calculated. The results for CP =3 mg/L is shown in Figure 3.
A framework for comparative eco nomic analysis among aerators for use in aquacultural ponds has been devel oped based on capitalization method, a life cycling costing approach.
»20 JUNE - JULY 2022

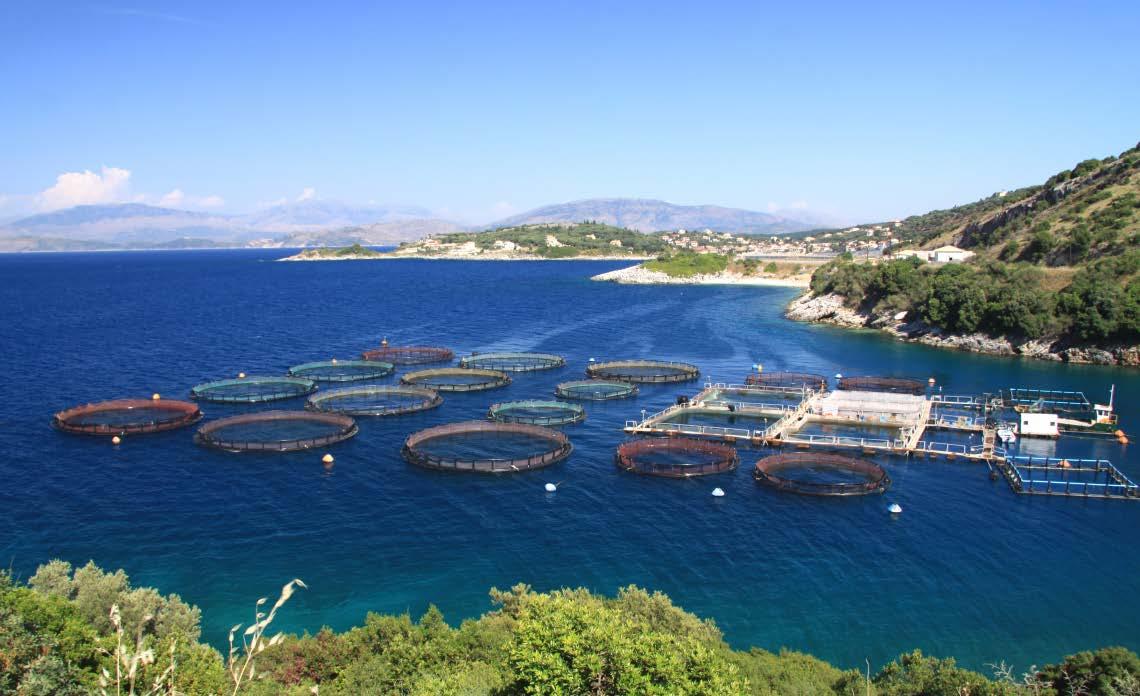
THE FUTURE OF FOOD from the sea ARTICLE
Based on the question of how much food we can sustainably obtain from the sea by 2050, an analysis of the main food-producing sectors in the sea is presented: wild fisheries, finfish mariculture and bivalve mariculture. From this, encouraging curves emerge for sustainable supply, taking into account ecological, economic, regulatory, and technological limits.
Human population growth, rising incomes and pref erence shifts will consid erably increase global de mand for nutritious food in the coming decades. Malnutrition and hunger still plague many countries, and projec tions of population and income by 2050 suggest a future need for more than 500 megatons (Mt) of meat per year for human consumption. Scal ing up the production of land-de rived food crops is challenging, be cause of declining yield rates and competition for scarce land and wa ter resources. Land-derived seafood (freshwater aquaculture and inland capture fisheries; seafood is used to denote any aquatic food resource, and food from the sea for marine re sources specifically) has an impor tant role in food security and global supply, but its expansion is also con strained.Similar to other land-based pro duction, the expansion of landbased aquaculture has resulted in substantial environmental externali ties that affect water, soil, biodiver sity and climate, and which compro mise the ability of the environment to produce food. Despite the im portance of terrestrial aquaculture in seafood production, many coun By: Aquaculture Magazine Editorial Team*
»22 JUNE - JULY 2022
» 23JUNE - JULY 2022
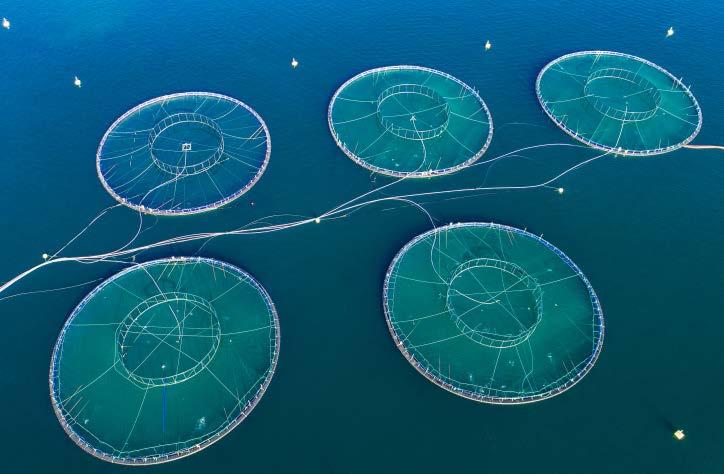
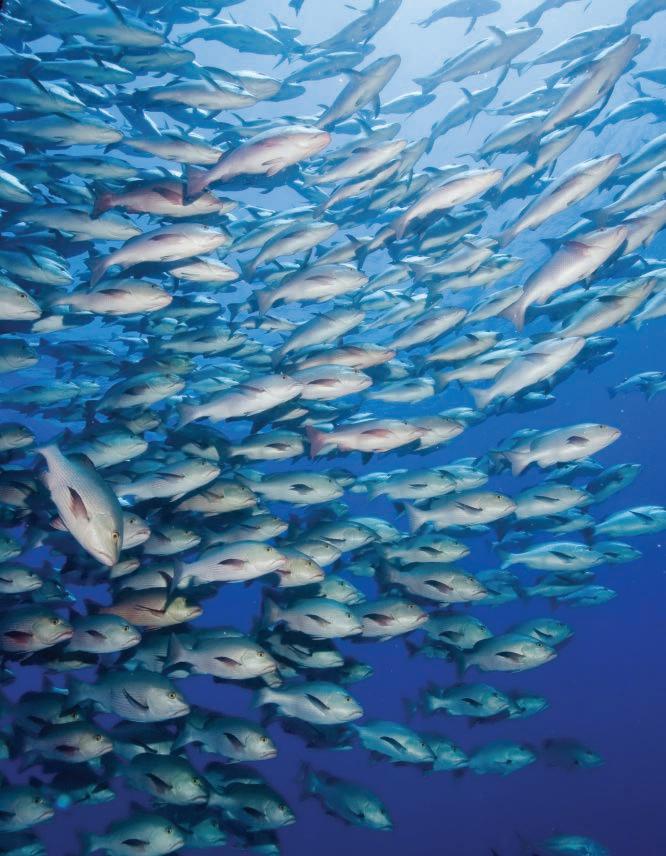
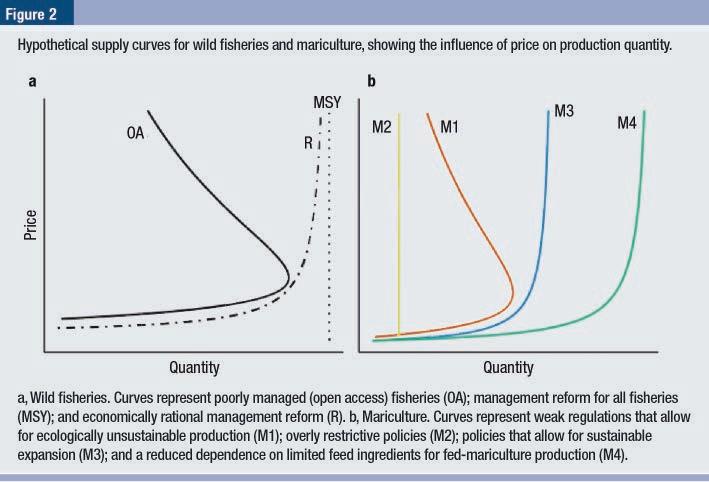
Sustainably increasing food from the sea Four main pathways by which food supply from the ocean could increase are: (1) improving the management of wild fisheries; (2) implementing policy reforms of mariculture; (3) advancing feed technologies for fed mariculture; and (4) shifting demand, which affects the quantity supplied from all three production sectors. Although mariculture production has grown steadily over the past 60 years (Figure 1) and provides an im portant contribution to food security, the vast majority (over 80%) of edible meat from the sea comes from wild fisheries (Figure 1b). Over the past 30 years, supply from this wild food source has stabilized globally despite growing demand worldwide, which has raised concerns about our ability to sustainably increase production. Of nearly 400 fish stocks around the world that have been monitored since the 1970s by the UN Food and Agriculture Organization (FAO), ap proximately one third is currently not fished within sustainable limits. Indeed, overfishing occurs often in poorly managed (‘open access’) fish eries. This is disproportionately true in regions with food and nutrition security concerns. In open-access fisheries, fishing pressure increases as the price rises: this can result in a ‘backward-bending’ supply curve (the OA curve in Figure 2a), in which higher prices result in the depletion Malnutrition and hunger still plague many countries, and projections of population and income by 2050 suggest a future need for more than 500 megatons (Mt) of meat per year for human consumption.
tries—notably China, the largest inland-aquaculture producer—have restricted the use of land and public waters for this purpose, which con strains expansion. Although inland capture fisheries are important for food security, their contribution to total global seafood production is limited, and expansion is hampered by ecosystem constraints. Thus, to meet future needs (and recognizing that land-based sources of fish and other foods are also part of the so lution), the question is whether sus tainable production of food from the sea plays an important role in futureHeresupply.we present an extensive analysis of the main food-producing sectors in the ocean—wild fisheries, finfish mariculture and bivalve mari culture—with an estimation of ‘sus tainable supply curves’ that account for ecological, economic, regulatory, and technological constraints.

First, in dependent of economic conditions, governments can impose reforms in fishery management. The resulting production in 2050 from this path way—assuming that fisheries are man aged for maximum sustainable yield (MSY)—is represented by the MSY curve in Figure 2a, and is independent of price.
The second pathway to sustain ably increase mariculture produc tion is through further technological advances in finfish feeds. Currently, most mariculture production (75%) requires some feed input (such as fishmeal and fish oil) that is largely derived from wild forage fisheries. If fed mariculture continues using fish meal and fish oil at the current rate, its growth will be constrained by the ecological limits of these wild fisher ies. A reduced reliance on fishmeal and fish oil is expected to shift the supply curve of fed mariculture to the right (curve M4 in Figure 2b).
»24 JUNE - JULY 2022
The final pathway is a shift in de mand (aggregated across all global fish consumers), which affects all three production sectors. When the sustainable supply curve is upwardsloping, an increase in demand in creases food production, for exam ple, from rising population, income or preferences Estimated sustainable supply curves
To meet future needs - and recognizing that land-based sources of fish and other foods are also part of the solution - the question is whether sustainable production of food from the sea plays an important role in future supply. ARTICLE of fish stocks and reduced produc tivity—and thus reduced equilibrium foodFisheryprovision.management allows over exploited stocks to rebuild, which can increase long-term food production from wild fisheries. Two hypotheti cal pathways by which wild fisheries could adopt improved management are presented (Figure 2a).
The explanations for why food production from mariculture is cur rently limited, and describe how the relaxation of these constraints gives rise to distinct pathways for expan sion are presented in Figure 2b. The first pathway recognizes that inef fective policies have limited the sup ply. Lax regulations in some regions have resulted in poor environmental stewardship, disease and even col lapse, which have compromised the viability of food production in the long run (curve M1 in Figure 2b). In other regions, regulations are overly restrictive, convoluted and poorly defined, and therefore limit produc tion (curve M2 in Figure 2b). In both cases, improved policies and imple mentation can increase food produc tion by preventing and ending envi ronmentally damaging mariculture practices (the shift from M1 to M3 in Fig. 2b) and allowing for environ mentally sustainable expansion (the shift from M2 to M3 in Fig. 2b).
The supply curves of food from the sea in 2050 for the three largest food sectors in the ocean are estimated as: wild fisheries, finfish mariculture and bivalve mariculture. Global sup ply curves for marine wild fisher ies are constructed using projected future production for 4,702 fisher ies under alternative management scenarios (Figure 3a). Managing all
ly recognizes that wild fisheries are ex pensive to monitor (for example, via stock assessments) and manage (for example, via quotas)—management reforms are adopted only by fisheries for which future profits outweigh the associated costs of improved man agement. When management entities respond to economic incentives, the number of fisheries for which the benefits of improved management outweigh the costs increases as de mand (and thus price) increases. This economically rational management endogenously determines which fish eries are well-managed, and thus how much food production they deliver, resulting in supply curve designated R in FigureAlthough2a. the production of wild fisheries is approaching its ecological limits, current mariculture produc tion is far below its ecological lim its and could be increased through policy reforms, technological ad vancements and increased demand.
The second pathway explicit
fisheries to maximize food produc tion (MSY) would result in 57.4 Mt of food in 2050, representing a 16% increase compared to the current food production (Figure 3a). Under a scenario of economically rational re form, the price influences production (Figure 3a). At current mean global prices, this scenario would result in 51.3 Mt of food (77.4 Mt live-weight equivalents)—a 4% increase com pared to current food production.
Managing all fisheries to maximize food production (MSY) would result in 57.4 Mt of food in 2050, representing a 16% increase compared to the current food production.
» 25JUNE - JULY 2022
The policy reform scenario— which assumes mariculture policies are neither too restrictive nor lax (curve M3 in Figure 2b), but that fish meal and fish oil requirements match present-day conditions—produces a modest additional 1.4 Mt of food at current prices. In this scenario, marine-based feed inputs limit mari culture expansion even as the price increases considerably. At current prices, economically rational production could lead to an increase from 2.9 Mt to 80.5 Mt of food (Figure 3c). Even if the model underestimates costs by 50%, policy reforms would increase the produc tion potential of both fed and unfed

»26 JUNE - JULY 2022 ARTICLE mariculture at current prices. For fed mariculture, this remains true even when evaluating mariculture species with different feed demands (Atlantic salmon, milkfish and barramundi). Estimates of future food from the sea
rine production at present, the pro jection is that by 2050 up to 44% of edible marine production could come from mariculture, although all sectors could increase production. Although even more substantial increases are technically possible (for example, fed mariculture alone is capable of gen erating at least the benchmark 177 Mt of additional meat), actually realizing these gains would require enormous shifts in demand.
The supply curves suggest that all three sectors of ocean food produc tion are capable of sustainably pro ducing much more food than they do at present. The quantity of seafood demanded will also respond to price (Figure 4). The intersections of fu ture demand and sustainable supply curves provide an estimate of fu ture food production from the sea. Because it is a substantial contribu tor to fish supply and—in some in stances—acts as a market substitute for seafood. Even under current de mand curves (green curves in Figure 4), the economically rational reform of marine wild fisheries and sustain able mariculture policies under the technological innovation (ambitious) scenario could result in a combined total of 62 Mt of food from the sea per year, 5% more than the current levels (59 Mt). Under the ‘future demand’ sce nario (purple curves in Figure 4), to tal food from the sea is projected to increase to 80 Mt. If demand shifts even more, the intersection of supply and demand is expected to increase to 103 Mt of food. Using the approach used by the FAO to estimate future needs, the world will require an addi tional 177 Mt of meat by 2050—the results suggest that additional food from the sea alone could plausibly contribute 12–25% of this need.
The results also suggest that the future composition of food from the sea will differ substantially from the present (Figure 5). Although wild fisheries dominate edible ma

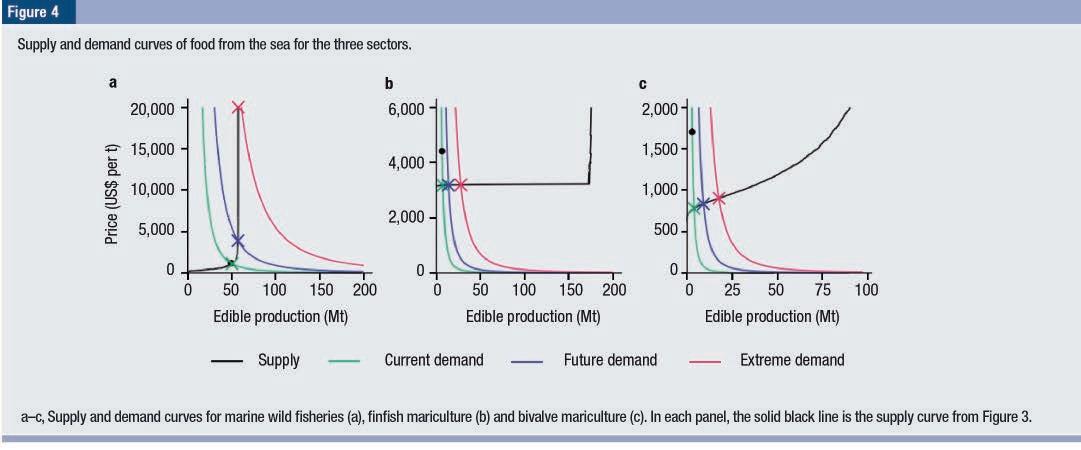
Global food demand is rising, and expanding land-based production is fraught with environmental and health concerns. Because seafood is nutri tionally diverse and avoids or lessens many of the environmental burdens of terrestrial food production, it is uniquely positioned to contribute to both food provision and future global food and nutrition security. The esti mated sustainable supply curves of food from the sea suggest substantial possibilities for future expansion in both wild fisheries and mariculture. The potential for increased global production from wild fisheries hing es on maintaining fish populations near their most-productive levels. For underutilized stocks, this will re quire expanding existing markets. For overfished stocks, this will require adopting or improving management practices that prevent overfishing and allow depleted stocks to rebuild. Climate change will further chal lenge food security. Estimates sug gest that active adaptation to climateinduced changes will be crucial in both wild fisheries and mariculture. Climate-adaptive management of wild fisheries and decisions regard ing mariculture production could improve food provision from the sea under conditions of climate change. The sea can be a much larger con tributor to sustainable food produc tion than is currently the case, and that this comes about by implement ing a range of plausible and action able mechanisms. The price mecha nism—when it motivates improved fishery management and the sustain able expansion of mariculture into new areas—arises from change in demand, and acts on its own without any explicit intervention. The feed technology mechanism is driven by incentives to innovate, and thus ac quire intellectual property rights to new technologies. When intellectual property is not ensured or to achieve other social goals, there may be a role for public subsidies or other invest ments in these technologies. The pol icy mechanism pervades all three pro duction sectors, and could make—or break—the ability of food from the sea to sustainably, equitably and effi ciently expand in the future.
CISNEROS-MATA - Instituto Nacional de Pesca y Acuacul tura, Guaymas, Mexico; CHRISTOPHER M. FREE - University of California. The original article was published in Nature in AUGUST 2020. The full version, including tables and figures, can be accessed online through this link: https://doi.org/10.1038/s41586-020-2616-y
This is a summarized version developed by the editorial team of Aquaculture Magazine based on the review article titled “THE FUTURE OF FOOD FROM THE SEA” developed by CHRISTOPHER COSTELLO - University of California; LING CAO - Shanghai Jiao Tong University, STEFAN GELCICH - Pontificia Universidad Católica de Chile; MIGUEL Á.
Conclusions
» 27JUNE - JULY 2022
»28 JUNE - JULY 2022
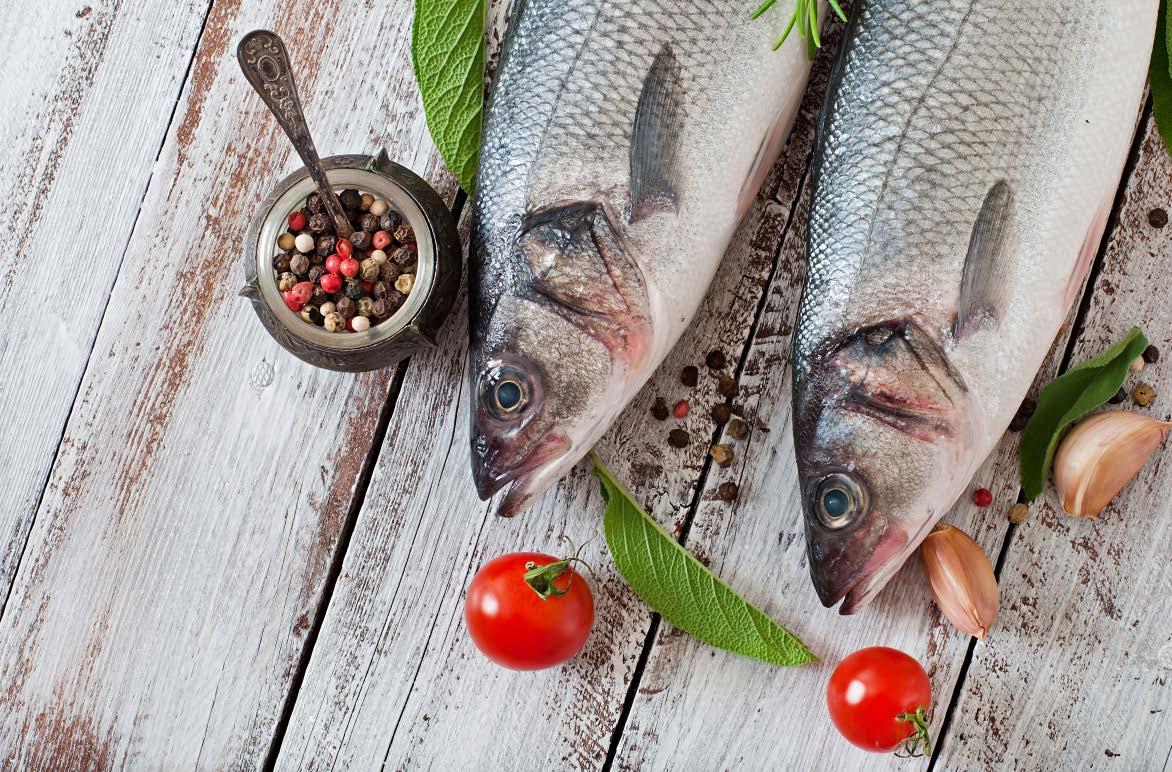
In shrimp feeds, a protein source with an adequate balance in amino acids is required to provide good growth performance. Animal byproducts from the rendering indus try have been increasingly used as dietary protein ingredients for ani mal production. Such residues have high nutritional value, and as such, they can be used as assets to gener ate biotechnological solutions for the
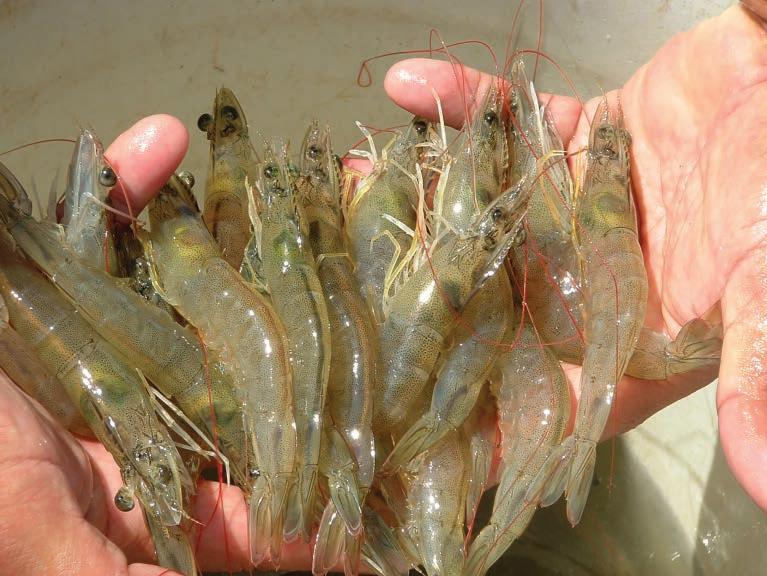
In 2017, the world’s production of Pacific white shrimp (Lito penaeus vannamei) was 4,456,603 tons, representing 80% of total shrimp production by aquaculture (FAO, 2018). One of the major ob stacles against the growth of shrimp farming is the reconciliation between intensification and the supply of good quality feed, mainly in terms of protein value and cost, in particular, because feed is essential for success ful intensive farming systems (Tacon and Metian, 2008).
In shrimp feeds, a protein source with an adequate balance of amino acids is required to provide good growth performance. Recent results showed that up to 25% of dietary protein replacement with protein hydrolysates from poultry by-product and swine liver, as an alternative dietary protein source for the Pacific white shrimp can improve its growth.
By: Aquaculture Magazine Editorial Team*
Protein hydrolysates from poultry by-product and swine liver as an alternative dietary protein source for the Pacific white shrimp ARTICLE feed industries. For this reason, the production of protein hydrolysates from agroindustrial waste presents an opportunity to optimize their use as a supply of animal protein for feed production.Inaquaculture, studies have re ported positive results for the use of protein hydrolysates as a protein source or feed additive relative to growth performance and the health of shrimp and fish. Protein hydro lysates from poultry and swine byproduct have emerged to aid in the formulation of more effective diets. To improve the performance of shrimp feeds, a protein hydrolysate was produced from the combination of poultry and swine liver in a way that improves the balance of essen tial amino acids. Besides improving nutritional value, such a combination increases consumption owing to the synergy between peptides present in the different protein sources. Design ing a combination of several protein sources subjected to enzymatic hy drolysis becomes an attractive pro cess by which to improve the perfor mance of the ingredients and identify optimal protein mixing formulations with specific characteristics. To date, no study has evaluated the use of protein hydrolysates from poultry by-product and swine liver in the diet of L. vannamei. Therefore, the objective of this article is to present a study placed to determine the appar ent digestibility coefficient of the pro tein hydrolysates of poultry by-prod uct and the combination of poultry and swine liver by-product in the diet of Pacific shrimp and to evaluate their effects on attractiveness and zootech nical performance of the species. Materials and methods
The specie used was the Pacific white shrimp Litopenaeus vannamei of a high health lineage, SPEEDLINE HB12,
The attractiveness of four dietary protein sources was evaluated accord ing to the methodology described by Nunes et al. (2006), using the Y-maze. Protein hydrolysate from poultry byproduct, protein hydrolysate from poultry by-product and swine liver, soybean meal, and salmon by-prod uct meal were evaluated. Soybean meal and salmon byproduct meal were evaluated because they are wide ly used ingredients in commercial di ets. Only two diets were compared per test, and all diets were compared to each other. For each comparison, a total of 10 tests were performed,
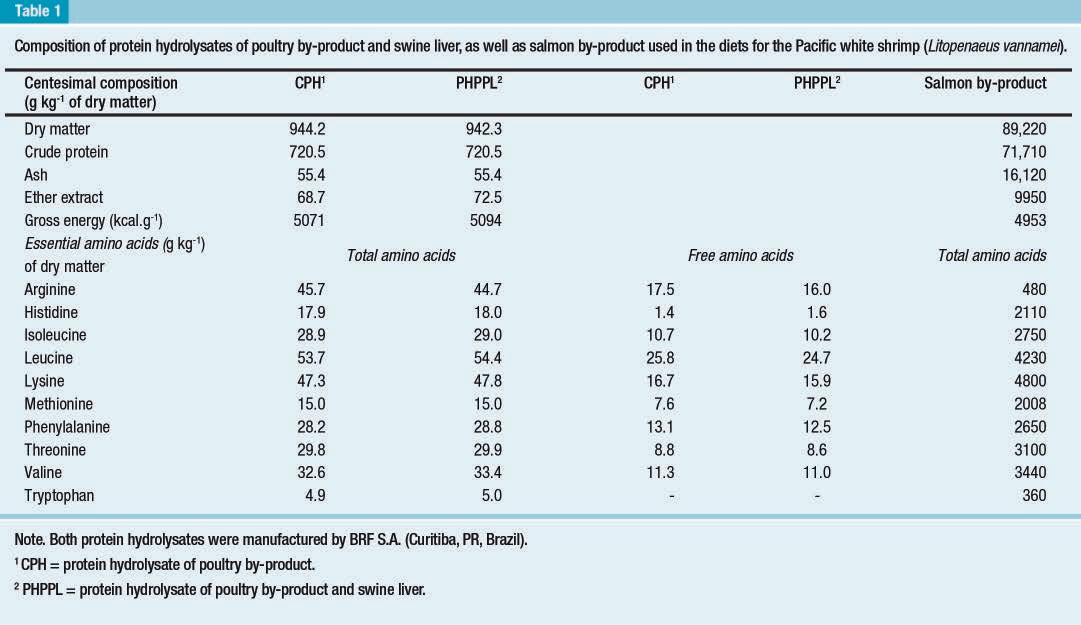
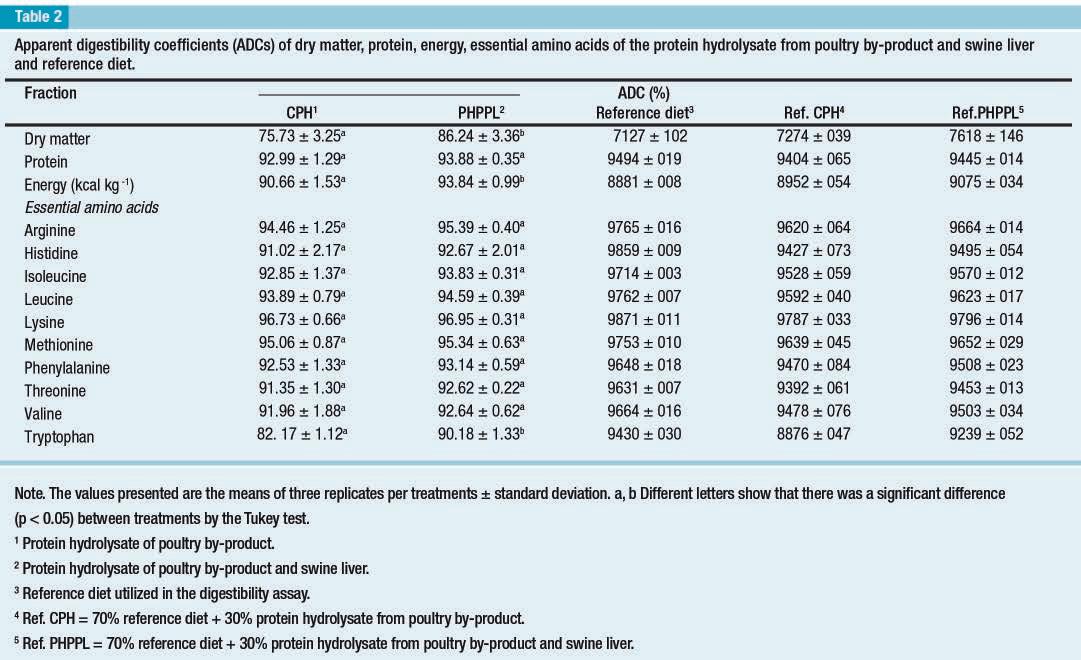
Protein hydrolysate from poultry by-product and swine liver was man ufactured and made available by BRF S.A. and is marketed as “aminEAU shrimp” (Curitiba, PR, Brazil). Two protein hydrolysates were used in the digestibility and attractiveness as say (Table 1), a protein hydrolysate of poultry by-products (chicken vis cera, giblets, meat, and antioxidant) and a protein hydrolysate combining protein hydrolysate of poultry byproducts and swine liver developed to meet the nutritional requirements in amino acids of marine shrimp. The combination of protein hydrolysates shows a better balance of total essen tial amino acids and a smaller amount of free amino acids, due to the hy drolysis process performed on raw materials (Table 1).
» 29JUNE - JULY 2022
Initially, shrimp were kept in three 6000-L tanks (one tank for each treat ment, n = 3) for seven days as an ac climation period for the experimental diets. Subsequently, groups of ten shrimp with a mean weight of 8.69 ± 0.73 g (intermolt) were transferred to twelve rectangular glass aquaria (60 L) connected to a seawater distribution system (collected from Barra da La goa Beach, Florianópolis, SC, Brazil), aeration system (O2 > 5 mg L-1), and constant heating (28 ± 1 °C).
Animal by-products from the rendering industry have been increasingly used as dietary protein ingredients for production.animal purchased from Aquatec Ltd. (Can guaretama, Rio Grande do Norte State, Brazil). The post-larvae were acquired with 4 mg and raised in a biofloc system at the Marine Shrimp Laboratory, Federal University of Santa Catarina (Florianópolis, SC, Brazil), until reaching the weight re quired to begin each trial.
For the growth performance assay in clear water, only the combination of the protein hydrolysates for shrimp was used. The molecular weight of the protein fractions of salmon by-prod ucts meal and protein hydrolysate of poultry by-product and swine liver was determined using the Nuclear Mag netic Resonance (NMR) technique. The apparent digestibility coef ficient (ADC) of dry matter, protein, amino acids, and energy of both pro tein hydrolysates was determined using the indirect method. The preparation of the diets was started by weighing the ingredients; then the macro and micro-ingredients were dry-blended.
replicates per treatment, with an aera tion system (O2 > 5 mg L−1) and constant water heating (28.49 ± 0.18 °C). All tanks were filled with saline water. Each tank was stocked with 30 shrimp with an average weight of 3.57 ± 0.04 g. The dietary treatments were distributed entirely at random among the tanks. Shrimp were fed six times a day, using feeding trays (area = 0.03 m2) made out of polyethylene material. Feed was initially supplied in a daily quantity equivalent to 6% tank biomass and was adjusted weekly ac cording to weight gain, survival, and feedDuringconversion.the six experimental weeks, dissolved oxygen and tem perature were monitored twice a day, but salinity, pH, ammonia, and nitrite were measured once a week. Water was exchanged once daily, until all or ganic matter content (feed waste, fe ces and, molting) was removed from the water, replacing about 80% of the total volume of water. Ten shrimp per tank were sampled weekly, and their mean weight was adopted as the weekly weight per tank. At the
»30 JUNE - JULY 2022 ARTICLE using one shrimp specimen per test. The total duration of each test was 7 min, and in case no shrimp was de tected by the time limit, the specimen wasForchanged.theprotein replacement feed ing trial five diets containing 32% di gestible protein, approximately 36% crude protein (CP), with 0, 25, 50, 75, and 100% substitution of the salmon by-product meal protein (71.71% CP) by protein hydrolysates from poultry by-product and swine liver (72.05% CP), the main protein source tested, were evaluated. A total of fifteen 50-L circular tanks were used, three
White shrimp showed no significant preference or rejection among the tested ingredients (CPH, PHPPL, soybean meal, and salmon meal). Growth assay
Attractiveness assay
At the end of the six weeks, the following growth parameters were evaluated: total weight gain, weekly weight gain, feed conversion, surviv al, and N or P retention. Results Digestibility assay
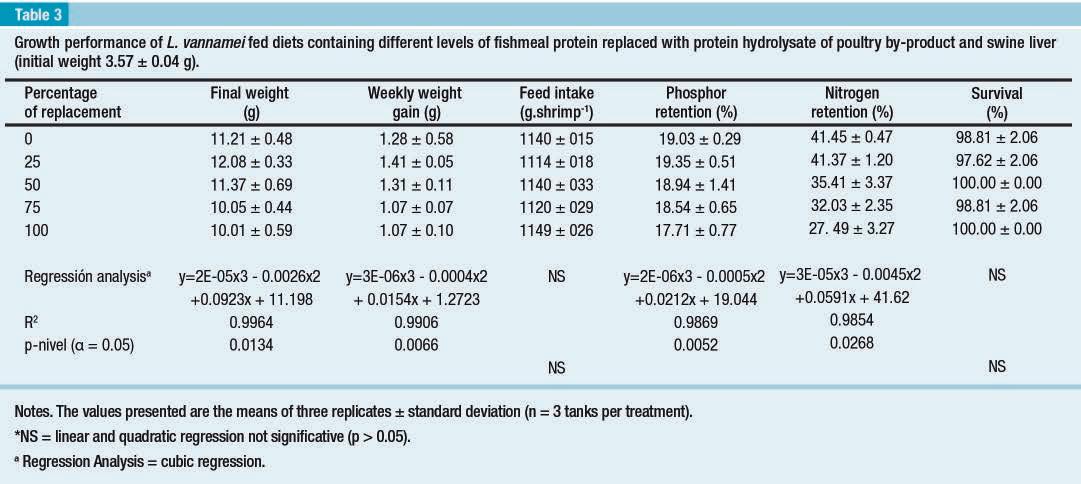
Regarding the parameters of growth as final weight, weekly weight gain, and total weight gain, we observed an increase in shrimp growth with 25% protein replacement of salmon byproduct meal by the protein hydroly sates of poultry and swine liver, with total weight gain presenting a peak at 24% replacement (4.8% actual inclu sion rate in diet). Diet with 50% pro tein replacement remained similar to the control diet (salmon by-product meal) with a subsequent decline in shrimp growth up to 100% protein replacement (Figure 1). Following the same trend as that shown by growth results, a decrease in shrimp feed conversion was ob served at 25% protein replacement with a similar result between control and 50% replacement and subsequent increase for the protein replacement up to 100% (Figure 1). The minimum was reached with 22.1% replacement.
In aquaculture, studies have reported positive results for the use of protein hydrolysates as a protein source or feed additive relative to growth performance and the health of shrimp and fish.
The ADC of dry matter and energy of the protein hydrolysate from poul try by-product and swine liver (PHP PL) was higher than that presented by the Protein Hydrolysate of Poultry by-product (CPH), but no difference (p ≥ 0.05) was observed for ADC of protein between both ingredients (Table 2). The ADCs of the amino acids of protein hydrolysates ranged from 82.17–96.95%. Among the es sential amino acid ADCs, only trypto phan ADC showed lower digestibility for CPH when compared to PHPPL (p < 0.05). Based on the nutritional composition of the protein hydroly sates (Table 1) and the ADCs, values of digestible energy and nutrients for the Pacific white shrimp were calcu lated (Table 2).
» 31JUNE - JULY 2022
Nitrogen and phosphorus reten tion followed the same trend. The
beginning and end of the growth as say, ten animals from each tank were collected for N (nitrogenous) and P (phosphorus) analysis.
For the growth assay, only PHPPL was used since it presented the best ADC in the digestibility assay. Survival was not significantly different among shrimp fed the experimental diets.

This is a summarized version developed by the editorial team of Aquaculture Magazine based on the review article titled “PROTEIN HYDROLYSATES FROM POULTRY BY-PRODUCT AND SWINE LIVER AS AN ALTERNATIVE DIETARY PROTEIN SOURCE FOR THE PACIFIC WHITE SHRIMP” developed by MARIANA SOARES - Aquaculture Department, Federal University of Santa Catarina; PRIS CILA COSTA REZENDE - Aquaculture Department, Federal University of Santa Catarina; NICOLE MACHADO CORRÊA - Aquaculture Department, Federal University of Santa Catarina; JAMILLY SOUSA ROCHA - Aquaculture Depart ment, Federal University of Santa Catarina; MATEUS ARANA MARTINS - Aquaculture Department, Federal University of Santa Catarina; THAÍS COSTA ANDRADE - R & D Animal Nutrition, BRF S.A.; DÉBORA MACHADO FRA CALOSS - Aquaculture Department, Federal University of Santa Catarina; FELIPE DO NASCIMENTOVIEIRA - Aqua culture Department, Federal University of Santa Catarina.
ARTICLE higher retention rates were found for the control diet and the replacement level of 25%, after which a decline was observed until the 100% replace ment level. Nevertheless, all protein replacement levels promoted satis factory growth for the species stud ied (Table 3).
In fish, growth improvement was re ported for different species when fed diets containing low concentrations of protein hydrolysates (Lewandows ki et al., 2013; Khosravi et al., 2015; Sary et al., 2017), corroborating the results obtained in our study.
Discussion
Conclusion
The enzymatic hydrolysis process proved to be highly efficient, modi fying the nutritional characteristics of the raw material used and making more nutrients available, generating an ingredient of high protein quality. The diet with a 25% protein re placement level presented more fa vorable results relative to the other dietary treatments, including a 10% increase in growth when compared to the control diet. Still, the best-estimat ed ED: PD ratio based on growth was 1,015 Kcal. g-1 for a diet containing 3,290 kcal kg-1 and 324 g.kg-1. How ever, a reduction in growth was ob served when salmon by-product meal protein replacement by PHPPL was above 50%. Therefore, the presence of a large amount of low molecular weight peptides (< 1.2 kDa) in the hy drolyzed protein seems to have lim ited their absorption by sea shrimp, even though they are more available in the tested ingredient. As reported in the literature, improvements were also observed in shrimp growth based on performance trials where lower con centrations of protein hydrolysates were used in diets for peneid shrimp (CórdovaMurueta and García-Car reño, 2002; Hernández et al., 2011).
»32 JUNE - JULY 2022
Protein hydrolysate from poultry byproduct and swine liver can be used as a dietary protein source for L. van namei based on the high digestibility and good profile of essential amino acids, similar to fishmeal, which is commonly used as the main protein source in shrimp diets. These ingredients can be included at lower concentrations in the diet to favor better growth performance. The maximum dietary inclusion for better growth of shrimp is 24% salmon byproduct meal protein replacement, i.e., 4.8% inclusion of the protein hy drolysates of poultry by-product and swine liver in the diet.
The original article was published in Aquaculture Reports, in Abril 2020. The full version, including tables and figures, can be accessed online through this https://doi.org/10.1016/j.aqrep.2020.100344link
»34 JUNE - JULY 2022 ARTICLE
As a global leader in aquaculture feed and animal nutrition, Cargill supports the production of seafood the world needs while minimizing its impact on the planet. And now is looking to do even more for sustainable aquaculture by focusing on farmers and working across the value chain to help the seafood industry reduce its global carbon footprint through the implementation of the SeaFurther TM Sustainability initiative.
By: Aquaculture Magazine Editorial Team*
SEAFURTHERTMSUSTAINABILITY IS CARGILL’S
In 1865, William Wallace Cargill becomes the owner of a grain warehouse in Conover, Iowa, at the end of the McGregor & Western Railroad line, and in 1870 establishes his headquarters in Al bert Lea, Minnesota. To date, Cargill serves customers and communities in 70 countries/regions with more than 155,000 employees, providing the world with the food, agricultural, fi nancial, and industrial products peo ple around the world need in a safe, responsible and sustainable manner. The company’s global operations are divided into five main categories: Food Ingredients & Organic Indus try, Animal Nutrition, Protein & Salt, Agricultural Supply Chain, and Met als & Shipping.
seafoodfootprintinitiativeAQUACULTURESUSTAINABLEtoreducethecarbonofitscustomers’farmedby30%by2030
Cargill’s goal is to help salmon farmers embark on a path to net-ze ro emissions. The program aims to re duce their carbon footprint by 30 per cent by 2030. However, commitments to sustainable aquaculture require a systematic approach.The company is measuring progress through carbon footprint reduction and cumulative carbon savings by using data from across its supply chain to its custom ers to track greenhouse gas (GHG) emissions per kilogram of its cus tomers’ harvested fish from 2017 to 2030 and manage the role of its feedin that reduction.
Cargill’s challenge Demand for seafood is rising. Emerg ing research, such as the 2021 Blue Food Assessment, shows how im portant aquaculture is to human nu trition – but aquaculture production must grow sustainably. Based on this, Cargill underscores the need to meet the challenge of sustainable aquacul ture by producing seafood in a way that protects the planet while feeding a growing human population. When feed is used in aquaculture, it is often responsible for 80% - even up to 90% - of the total carbon foot print of the harvested fish. The raw materials that make up the feed carry most of that burden, and the efficien cy of feed use on the farm is an im portant factor in the overall footprint of the fish. With this knowledge, Cargill can target its efforts.
» 35JUNE - JULY 2022
Key areas for achieving the goal Cargill is focusing on the three key areas described below to achieve this ambitious goal by developing the best solutions for individual customers ac cording to their unique needs. Transforming raw materials
Cargill’s feeds are designed to help en sure that the environmental footprint of aquaculture is as small as possible. To do this, the company works close ly with its suppliers to grow environ mentally friendly ingredients and find ways to reuse byproducts, such as fish trimmings, that would normally be discarded, whenever possible. To gether, Cargill and its suppliers strive to identify and source new ingredi
Cargill’s solution Cargill, together with its suppli ers, farming customers, and global communities, is charting a bold new course – making aquaculture better for the planet and ensuring sustain able seafood is available to all. This includes the launch of a new global initiative called SeaFurther™ Sus tainability, which aims to bring about real change across the seas.
As the world’s leading supplier of feed for aquaculture and animal nutrition, Cargill supports the production of seafood the world needs while minimizing its impact on the planet.
How Cargill plans to reach the goal Cargill is launching the SeaFurther™ Sustainability initiative to help farm ers reduce their carbon footprint by at least 30 percent by 2030. By do ing this at scale and across many cus tomers, it will help the industry save 2 billion kilograms of carbon emis sions which is equivalent to the emis sions of more than 400,000 cars in one year. Credibility and innovation are key factors that Cargill uses to un derpin every it does. The company’s first target is to reduce GHG by 15 percent by 2026.
When feed is used in aquaculture, it’s often responsible for 80% - even as much as 90% - of the total carbon footprint of the harvested fish.
To achieve this goal, Cargill has set priorities that address the multiple environmental, social, and economic impacts of its business. Cargill rec ognizes that no company can solve these challenges alone. Therefore, it connects and collaborates with its suppliers, farming customers, and global communities to achieve a common goal.

Neil Manchester, Managing Direc tor of the Kames Fish Farming Ltd said, “We recognize our role as provid ing a solution to the ocean’s recovery whilst feeding the increasing popula tion and understand the responsibil ity that farming in the sea entails. We are proud to lead the way for reduc ing emissions from the trout industry through this partnership with Cargill. However, carbon efficiency resulting in reduced emissions will only be fully achieved if we work together across ARTICLE
Cargill is also optimizing the nu trition provided to its customers by working to reduce the amount of feed needed for farmed fish – the feed conversion ratio. Collaborat ing with its customers, it will provide the nutrients needed and work with the farmers to feed fish optimally for efficient growth. Reducing the feed used for fish farming is a strong driv er for more sustainable aquaculture that uses fewer resources and results in fewer losses and emissions.
»36 JUNE - JULY 2022
ents that will lead to even more sus tainable feeds and help its customers and partners achieve shared sustain abilityFeedgoals.ingredients are a key part of the overall aquaculture footprint. Switching raw materials from one source to another with a smaller foot print can provide an immediate solu tion. However, Cargill believes it is best to work with its suppliers to find ways to reduce their emissions. This is done directly by collaborating on solutions to reduce emissions from crop production by adopting regen erative farming practices, optimizing processing, and streamlining logistics.
Optimization of production Intending to put fish nutrition first, Cargill is harnessing the power of na ture and science to do more with less environmental impact. The company is focused on ways to increase the ef ficiency of fish production, getting the most out of production while us ing fewer resources and reducing its impact on the ocean and climate. Through SeaFurtherTM, the com pany will work with its customers to identify the GHG hotspots in their production – from raw materials and feeds to fish production. It can then work with customers to identify ac tions that can strategically reduce emissions.Cargill will optimize the GHG footprint of the feeds it offers. The formulation will allow the company to mix its ingredients differently to deliver the same great superior nutri tion value, but with a lower total foot print. This will build on the capabili ties of the changed supply chain.
Safeguarding animal health Healthy farmed fish play a powerful role in the health of communities –and the environment. That’s why fish welfare is at the top of Cargill’s agenda. It takes time and cares to develop fish nutrition that promotes and improves the health and welfare of farmed fish. It is committed to working with its customers to ensure that the fish in its care are held to the highest standards. By providing optimal nutrition to the fish Cargill feeds, they stay health ier. When the focus is on health and well-being through nutrition, the fish are less likely to get sick. Healthy fish grow more efficiently, so more fish can be raised with fewer resources –with fewer greenhouse gas (GHG) emissions. Targeting improvements at every step of the value chain Collaboration is at the heart of the SeaFurtherTM initiative, and the car bon footprint of farmed salmon ex plains why. Cargill expounds, “Op timizing each link in the value chain will only take us so far. Exploring GHG emissions reduction initiatives – together – will enable us to meet the rising demand for seafood sus tainably”.
Cargill is working with novel ingredients and continuing to increase its use of by-products, driving a circular economy approach for feed in aquaculture.
To achieve a sustainable aquacul ture industry, Cargill is also working with novel ingredients and continues to increase its use of by-products to take a circular economy approach to aquaculture feeds. In doing so, Car gill is building on its leading experi ence in the use of fish trimmings and other by-products wherever possible to move closer to the goal of overall carbon emissions reduction.
» 37JUNE - JULY 2022
This is a summarized version developed by the editorial team of Aquaculture Magazine based on the review article titled “SEAFURTHERTM SUSTAINABILITY. CARGILL’S SUSTAINABLE AQUACULTURE INITIATIVE TO REDUCE THE CARBON FOOTPRINT OF OUR CUSTOMERS’ FARMED SEAFOOD BY 30% BY 2030” developed by CARGILL The original article was published on Cargill’s web page, in 2022. The full version can be accessed freely online through this link: supply-chains/seafurther-sustainability-aquaculturehttps://www.cargill.com/sustainability/ This informative version of the original article is sponsored by Cargill By seeking to put fish nutrition first, Cargill is harnessing the power of nature and science to do more with less environmental footprint. the whole supply chain, so it’s fantastic that this initiative and open commu nication is happening rapidly and at scale”.Pablo Baraona Director of Salmo nes Aysén said, “Salmones Aysén is a family-owned and operated company that have been in the path of becom ing carbon neutral company with a carbon neutral produce for a few years now. Adopting different politics on how to farm and process our salmon, we are changing our culture and grow ing into this new way of farming to achieve, not only a zero emission but a sustainable and fair way of produc ing salmons. Our commitment comes from the very heart of the company, because is a conviction that the own ers of the company have themselves, not only in this company, but in life. Therefore, we have decided to commit with the SeaFurtherTM program along with Cargill to move forward with this objective that we are convinced we are going to achieve in the coming years”.
Conclusion There is a need to ensure that the aquaculture sector continues to grow and make an ever-increasing contribution to the world’s food supplies in a socially, economically, and environmentally sustainable manner, consistent with the United Nations Sustainable Development Goals. Cargill is charting a bold new course to make aquaculture better for the planet with the SeaFurther TM Sustainability initiative. The focus is on three key areas: transforming raw materials, optimizing production and safeguarding animal health, and also targeting improvements at every step of the value chain with the ac tive collaboration of farmers to help the seafood industry reduce its glob al carbon footprint. In specific, its goal is to help salmon farmers chart a path to net-zero emissions, with a program aiming to reduce their car bon footprint by 30 percent by 2030.

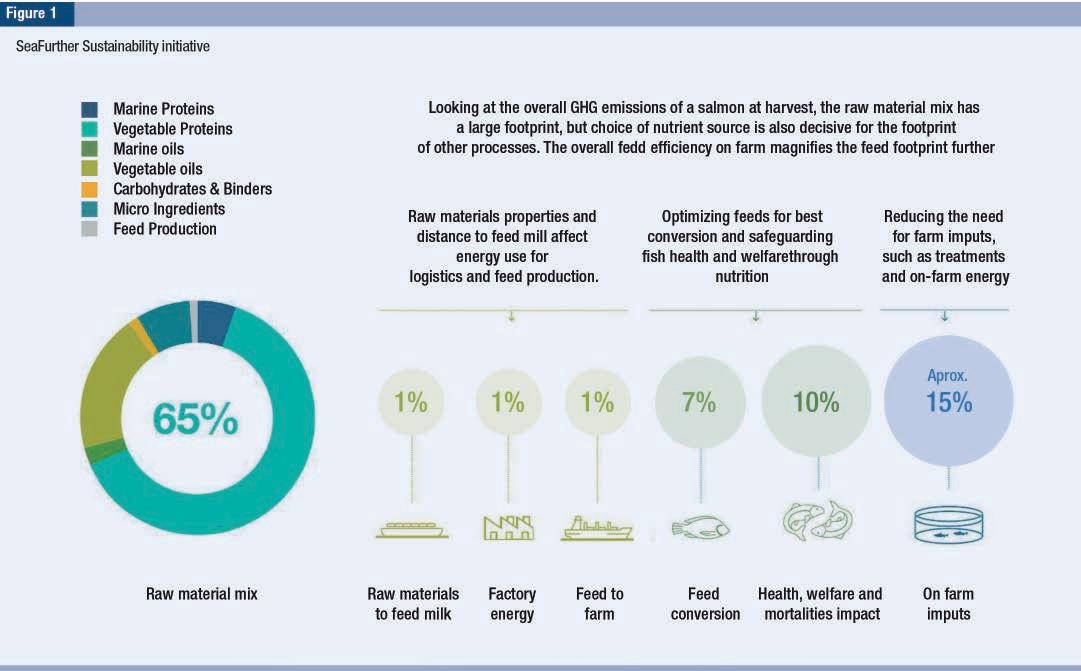
By: Aquaculture Magazine Editorial Team* In terms of dietary composition, protein is the single largest and most expensive component in fish feed. Fish meal (FM) is a source of high-quality protein and highly digestible essential amino and fatty acids, making it a popu lar source of protein in aquaculture feeds. Worldwide production of FM has been stable at roughly 6.3 million metric tons annually since the 1980s. Once seen as a renewable source, FM costs have increased as demand has increased, while supply has slowly decreased due to overfishing. In ad dition, FM varies greatly in compo sition and quality among species or with age, season, geographic origin, and processing methods. Therefore, it is critical to investigate alternative protein sources to FM protein in aquaculture feeds.
In terms of dietary composition, protein is the single largest and most expensive component in fish feed. A feeding trial was conducted to determine the maximum substitution limits of poultry by-product meal protein for fish meal protein in the diet of juvenile Black Sea Bass Centropristis striata. Results showed poultry by-product meal as a promising alternative protein source for sustainable diet development in Black Sea Bass.
»38 JUNE - JULY 2022 ARTICLE EVALUATION OF POULTRY BY-PRODUCT MEAL AS AN ALTERNATIVE TO FISH MEAL in the Diet of Juvenile Black Sea Bass Reared in a Recirculating Aquaculture System
» 39JUNE - JULY 2022
Terrestrial animal protein sources have several advantages, including a similar amino acid profile to FM, availability, and relatively low cost.
Black Sea Bass is a commercially important marine finfish species in habiting coastal waters of the east ern USA, from the Gulf of Maine to Florida that commands a high market value. Its abundance along the U.S. East Coast has been declining since the1950s and stringent quotas are in effect for harvesting of wild popula tions. Potential for limited market sup plies and for higher prices of ocean caught Black Sea Bass in the future are important economic incentives to investigating the feasibility of Black Sea Bass production via aquaculture to help meet market demand. Here we present a study conducted to de termine under controlled laboratory conditions the maximum substitution limits of the animal protein source PBM for FM protein in juvenile Black Sea Bass diets and the effects of re placement on whole body and muscle tissue proximate composition. Methods Experimental animals and system Juvenile Black Sea Bass were cultured from eggs spawned by photother mally conditioned broodstock held at the University of North Caro lina Wilmington Aquaculture Facility (Wrightsville Beach, North Carolina). Broodstock were induced to spawn using luteinizing hormone-releasing hormone analog implants. Eggs were hatched and reared through the juve nile stage in 150-L tanks.
Experimental diets and feeding protocol Eight diets were formulated to re place FM protein with pet-feed-grade PBM protein at levels of 0 (control), 40%,50%, 60%, 70%, 80%, 90%, and 100% (Table 1). All diets were formulated to have the same crude protein level (44%) and lipid level (13%). The analyzed crude protein levels in the test diets are showed in Table 1. Except for wheat gluten as a
The experimental system consist ed of 24 75-L rectangular (76 cm × 32 cm × 43 cm) glass tanks support ed by a recirculating seawater system located in a controlled-environment laboratory. Water quality was main tained by a bead filter, a foam frac tionator, and a UV sterilizer. Tanks were subjected to a 12 h light: 12 h dark photoperiod supplied by eight 60-W fluorescent lamps in addition to ambient light levels from sunlight entering the laboratory windows.
The two most common chicken in gredients in pet feed are poultry meal and poultry by-product meal (PBM). PBM is a protein source produced from waste and by-products of pro cessed chickens. It has been used suc cessfully to replace FM at high levels of dietary inclusion for a number of finfish species.
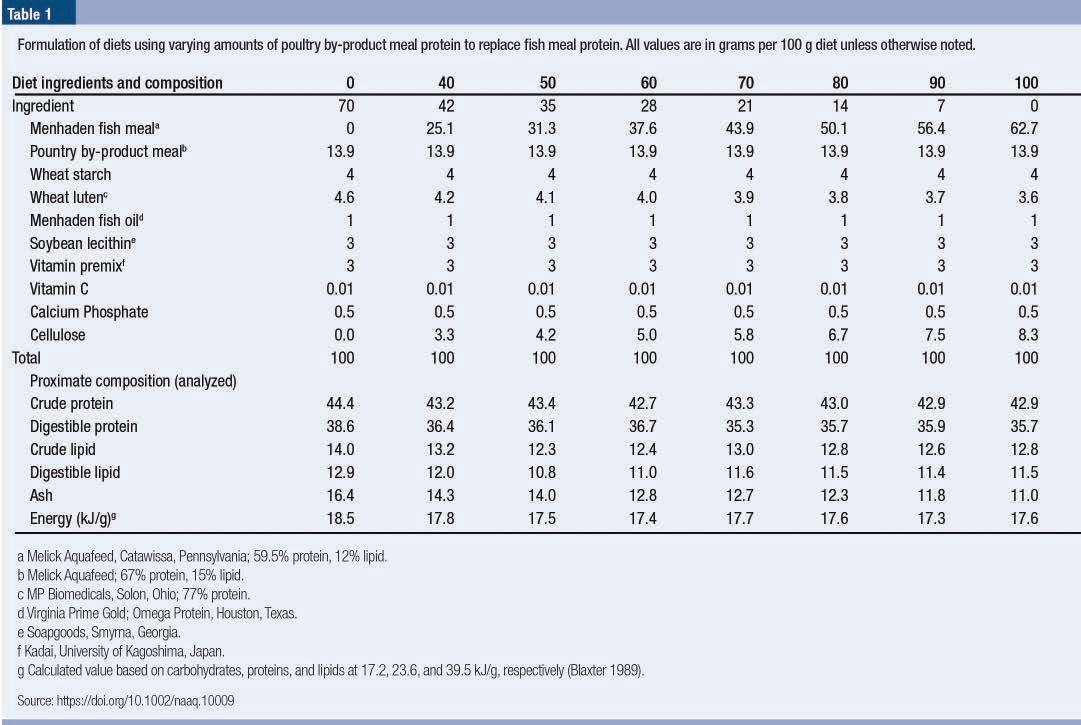
At the end of each experiment, 8–10 fish from each tank were collected for biochemical analysis. Five fish were used to determine proximate com position (moisture, ash, lipid, and protein) and fatty acid profiles of the whole body and from three to five fish were dissected to analyze the proxi mate composition of muscle tissue.
Results and Discussion Survival and Growth At the end of the experiment on day 56, survival ranged from 95% to 100%, with no significant (P > 0.05) differences among treatments (Table 2). No significant differences in mean fish weights (range = 1.1–1.3 g) were observed among treatment groups at the beginning of the experiment (day 0) (Figure 1). By day 14, fish mean weights ranged from 4.1 to 4.3 g, with no significant differences. On day 28 and day 42, fish fed the 100% PBM protein diet were significantly smaller (6.6 g and 9.9 g, respectively) than fish fed the control FM diet (7.9 g and 13.0 g, respectively). At the end of the experiment (day 56), fish weight in the 100% PBM protein diet was signifi cantly lower (13.6 g) than in the con
In terms of dietary composition, protein is the single largest and most expensive component in fish feed. binder, no additional protein sources, amino acids, or attractants were used. All diets contained the same amount of vitamin and mineral premix. At lantic Menhaden fish oil and soybean lecithin were used as lipid sources in addition to the lipid content found in the protein sources. Treatment diets were fed twice daily (0900 and 1500 hours) to triplicate groups of juve nile Black Sea Bass to apparent satia tion (i.e., as much as fish could con sume without wastage) for 8 weeks.
»40 JUNE - JULY 2022 ARTICLE
Proximate composition of diets and fish tissues
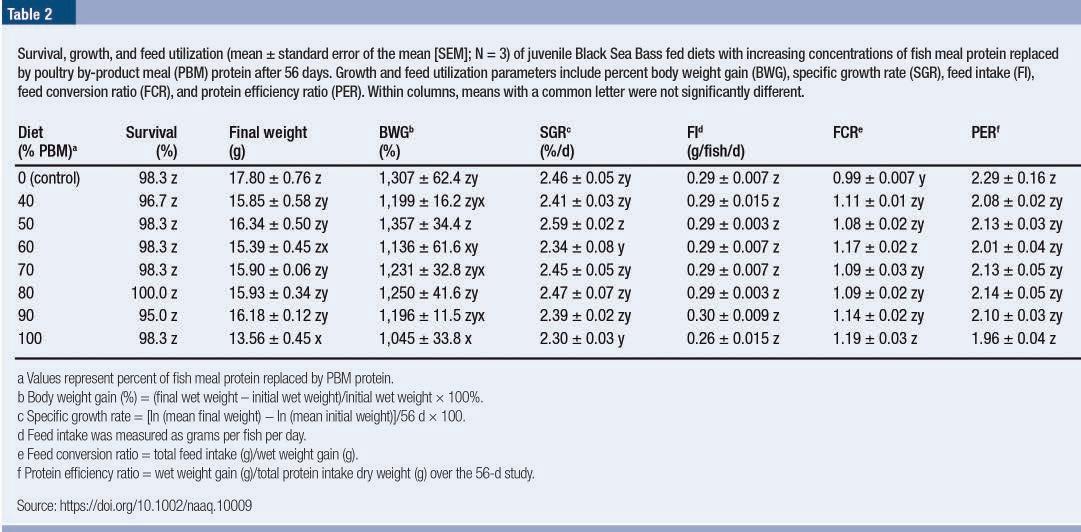
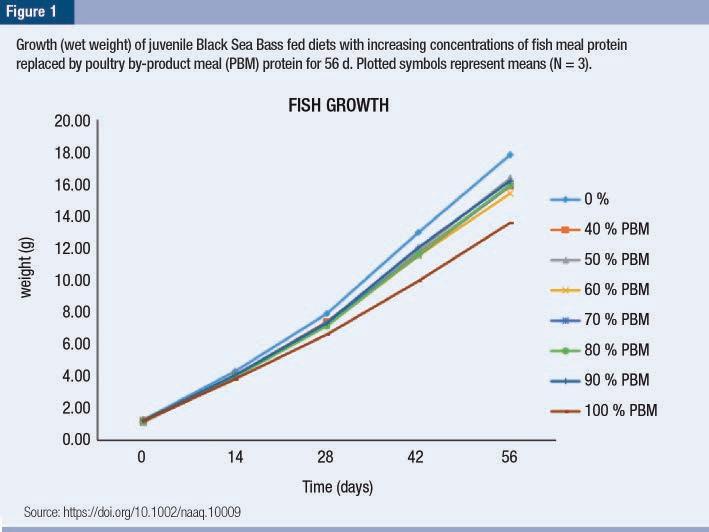
Whole body moisture content was significantly higher in Black Sea Bass fed diets with 50–80% and 100% PBM protein. Whole body ash con tent increased with increasing levels of PBM protein in the diet while moisture, ash, and protein content of the muscle tissue showed no signifi cant differences among fish fed the different diet treatments.
Although total lipid content of the whole body was not significantly dif ferent between fish fed PBM protein and FM protein, the composition of fatty acids in the whole body reflected dietary levels of the terrestrial animal and marine protein sources used.
Survival of juvenile Black Sea Bass in all diet treatments was excel lent throughout the experiment with little or no mortality. This is similar to what has been reported in other carnivorous marine finfish species, which showed high survival when fed diets with FM protein replaced by PBM protein at levels of 20–100%. Feed utilization No significant differences in feed intake were observed, which ranged from 0.26 to 0.30 g/fish/d (Table 2). Feed conversion ratios (FCRs) for fish fed the 60% PBM protein diet (1.17) and the 100% PBM protein diet (1.19) were significantly higher than fish fed the control FM protein diet (0.99) (Table 2). Feed intake in juve nile Black Sea Bass did not differ sig nificantly among treatments, suggest ing that palatability was not affected by substitution of PBM protein for FM protein in the treatment diets. Fish whole body and muscle tissue proximate composition Fish whole body moisture con tent ranged from 63.5% to 66.2% among treatments (Table 3). Whole body moisture content of fish fed diets with 50–80% PBM protein (65.6–65.8%) and 100% PBM pro tein (66.2%) was significantly higher than in fish fed the control FM diet (63.5%). Fish whole body ash con tent ranged from 4.49% to 6.37% (Table 3) among treatments. No sig nificant treatment differences were observed in fish muscle moisture (75.5–76.4%), ash (1.29–1.34%), or crude protein (18.1–20.1%) content (Table 4). The muscle tissue crude lipid level of fish fed the 50% PBM protein diet (3.4%) was significantly higher than in fish fed the control FM protein diet (2.7%) (Table 4).
» 41JUNE - JULY 2022 trol FM protein diet (17.8 g) (Table 2).
Oleic acid (n-9: number of the car bon atoms in the compound) levels increased with increasing PBM pro tein in the diet, causing a correspond ing increase in total monounsaturated fatty acid (MUFA) concentrations with increasing PBM protein. Clearly, PBM contains higher MUFAs than FM, and high levels of dietary PBM produced high amounts of MUFAs in the whole body of juvenile Black Sea Bass. This same trend was ob served in linoleic acid (n-6) and the sum of n-6 polyunsaturated fatty ac ids (PUFAs) in the whole body of ju venile Black Sea Bass. Similarly, juve nile Coho Salmon Oncorhynchus kisutch fed a diet completely replacing FM protein with PBM protein contained elevated oleic acid, total MUFA, lin oleic acid, and total n-6 PUFA levels (Twibell et al., 2012). In the present study, fish fed the 100% PBM diet showed the lowest growth performance, and this may
Fatty acid profile of the diets and whole bodies
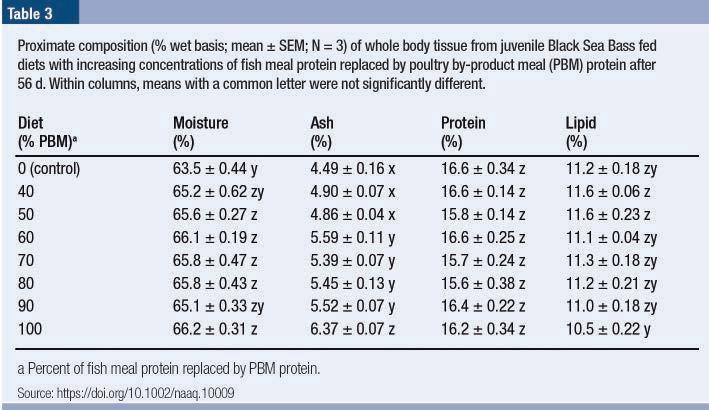
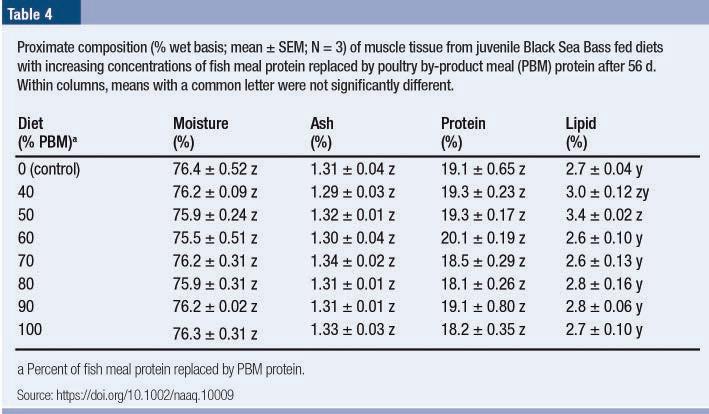
The EPA and DHA levels for the diets replacing up to 90% FM protein with PBM protein met or exceeded the minimum recommended dietary levels for other marine fish, such as Red Seabream Pagrus major and Yel lowtail Seriola quinqueradiata (Sargent et al., 2002). A significantly lower n3 to n-6 PUFA ratio in the whole body of Black Sea Bass fed PBM-based di
Conclusion The results demonstrated that FM protein can be replaced by feed-grade PBM protein in juvenile Black Sea Bass diets at levels as high as 81.8% without adversely affecting survival, growth, feed utilization, fish biochem ical composition, or ADC of protein or lipid. Poultry byproduct meal is a highly effective protein source for al ternative protein-based feed formula tion for Black Sea Bass.
»42 JUNE - JULY 2022
The PBM used in the present study had higher lipid content than the FM, so less fish oil was added as PBM was increased in the diets to maintain the diets isolipidic. Hence, the diet replacing 100% FM protein with PBM protein contained 1.2% less fish oil than the high FM based control diet. Since PBM is low in n-3 PUFAs, the substitution of PBM protein for FM protein and the incre mental reduction of fish oil reduced EPA and DHA levels in the diets. However, growth performance was not impaired up to a substitution lev el of 90% PBM protein.
ets compared with the fish fed control FM protein diet was also observed in this study. Replacing FM protein with PBM protein in the diets of Black Sea Bass also did not affect the ratio of DHA to EPA (0.84–1.01) found in the whole body, a level which was above the dietary requirement for Yellowtail (0.5) (Sargent et al., 2002). No recommended level of EPA or DHA in the diet for Black Sea Bass has been published. However, based on the EPA and DHA levels in the diets in this study and the reported requirements for other marine spe cies, sufficient EPA and DHA were provided in all the diets replacing FM protein with PBM protein. Also, the apparent digestibility coefficients (ADC) of protein ranged from 82% to 84%, which is similar to values re ported for other species.
This is a summarized version developed by the editorial team of Aquaculture Magazine based on the review article titled “EVALUATION OF POULTRY BY-PRODUCT MEAL AS AN ALTERNATIVE TO FISH MEAL IN THE DIET OF JUVENILE BLACK SEA BASS REARED IN A RECIRCULATING AQUACULTURE SYSTEM” developed by MATTHEW R. DAWSON, MD SHAH ALAM, WADE O. WATANABE, PATRICK M. CARROLL and PAMELA J. SEATON - University of North Carolina Wilmington. The original article was published in NORTH AMERICAN JOURNAL OF AQUACULTURE in FEBRUARY, 2018. The full version, including tables and figures, can be accessed online through this link: DOI: 10.1002/naaq.10009 ARTICLE also be due in part to the relatively low dietary levels of essential fatty acids, particularly the long-chain n-3 poly unsaturated fatty acid (PUFAs), (n3) eicosapentaenoic acid (EPA), and (n-3) docosahexaenoic acid (DHA). The lipids present in the poultry meal are generally rich in MUFAs (particu larly oleic acid) and total n-6 PUFAs but are low in n-3 PUFAs, EPA, and DHA (Higgs et al., 2006). The PBM protein can be included up to a level of 44% in diets for juvenile Rainbow Trout without a decrease in EPA and DHA in whole body tissues (ParesSierra et al., 2014). Given the trend toward lower dietary n-3 PUFAs with increasing incorporation of PBM protein, the comparable levels of n-3 PUFAs in whole body tissues among all diet treatments are noteworthy and may suggest that dietary n-3 PUFA requirements were met under all diet treatments.Thissupports the idea that growth inhibition in the 100% PBM protein diet may have been due to an amino acid deficiency. Fish fed the 50% PBM protein diets showed much higher whole body EPA, DHA, and n-3 PU FAs than the fish fed the others diets, but this was possibly due to the inad vertent selection of bigger fish for fat ty acid analysis in that diet treatment.
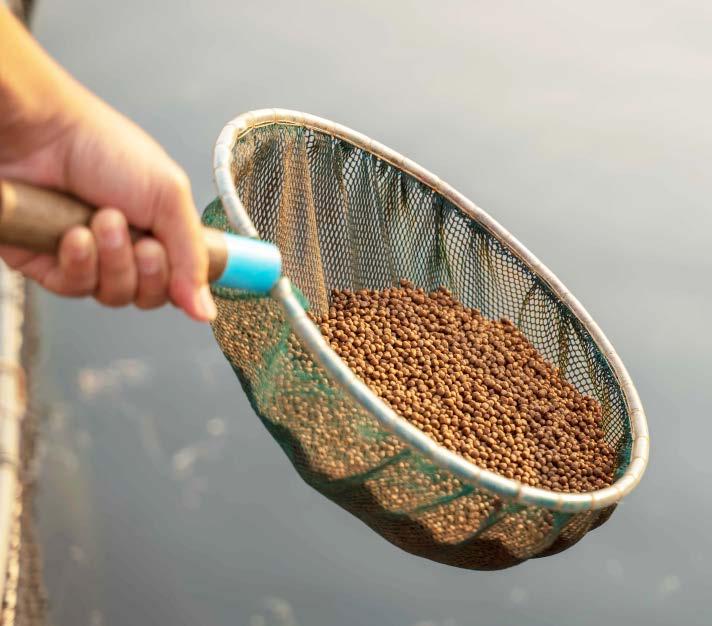

»44 JUNE - JULY 2022 ARTICLE
By: Aquaculture Magazine Editorial Team* D ue to high demand and exhausted natural fish eries stock, the aquacul ture sector has grown rapidly, with aquaculture products currently representing more than 50% percent of seafood produc tion for human consumption (FAO, 2020). Although most aquaculture is pond based, indoor aquaculture is growing in popularity, especially in inland areas where fresh seafood products are often difficult to ac quire. Such indoor operations primar ily utilize recirculating aquaculture systems (RAS). RAS are contained production systems that provide substantial environmental control, including solids filtration, biofiltra tion, temperature control, and other control mechanisms based largely on animal needs and climate consider ations. RAS also require much less space than pond-based aquaculture through higher production densi ties, allowing them to be situated in a variety of building types. Due to the costs of RAS, high-value species are being investigated for their suitabil ity in RAS production as the Pacific white shrimp (Litopenaeus vannamei).
Using alternative low-cost artificial sea salt mixtures for intensive, indoor shrimp (Litopenaeusvannamei) production
One limiting factor in RAS ma rine shrimp production is the need for salt to create marine or brackish water. Most inland areas do not have direct access to saltwater; therefore, shrimp production operations must use an artificial marine salt mix. Most commercial salt mixes attempt to replicate the mix of elements found in natural seawater, including trace minerals such as Fe, I, Zn, and Mn. Some of these trace elements have been shown to play a role in physi ological functions when included in the shrimp diet. These commercial marine salt mixes can represent a sig nificant portion of production costs for inland shrimp producers. Simpli fying these salt mixes down to only essential elements may reduce costs for producers by reducing the num ber of ingredients and facilitating inhouse made salt mixes.
A previous experiment found that there were no significant differences in shrimp production when using five salt mixtures: containing 100% commercial sea salt (CSS), 75% CSS and 25% of a least cost salt mix (LCS), 50/50% CSS/LCS, 25/75% CSS/LCS, and 100% LCS (Tierney et al., 2021). Although there were no significant differences in that study, shrimp survival in the 100% LCS treatment was low at 57%, whereas the other treatments averaged 70% survival. The purpose of the cur rent experiment was to further ex amine salt mixtures in the range of 75% LCS to 100% LCS due to the low survival found in Tierney et al. (2021) and definitively determine if a LCS can result in adequate shrimp production, maintain acceptable wa ter quality levels, and reduce salt cost in intensive, indoor shrimp aquacul ture systems.
Artificial sea salt mixtures are required for shrimp inland production, which can be a substantial portion of the production costs. This article presents results that indicate that using the low-cost artificial sea salt (LCS) formulation reduces artificial sea salt cost significantly, up to 15%, while having no significant impacts on shrimp production and water quality compared to a commercial marine salt mixture.
Results
Water quality Salinity in all systems was kept at 15 g L-1 throughout the experiment. Any water loss due to evaporation was re placed with dechlorinated municipal water. When pH fell below 7.8, this was adjusted with additions of 35 g of sodium bicarbonate. Temperature, dissolved oxygen (DO), pH, and sa linity were all measured twice daily at approximately 08:00 and 16:00 h. To tal ammonia nitrogen (TAN), nitrite, and turbidity were measured once weekly during this study.
» 45JUNE - JULY 2022 Materials and Methods
This experiment took place in the Kentucky State University (UK), Sus tainable Aquaculture Development Lab (SADL). The SADL is a 174 m2 insulated and climate-controlled building used for indoor aquaculture research. Five treatments were devel oped for this experiment, each with 4 replicated tanks for a total of 20 tanks. Each treatment used different com binations of two salt mixes to reach the target salinity. The two salts were a commercial sea salt mixture, Crystal Sea Marine Mix (CSS) (Marine Enter prises International, Baltimore, MD, USA); and a least-cost salt mixture (LCS) made from sodium chloride (NaCl), magnesium sulfate (MgSO4), magnesium chloride (MgCl2), calcium chloride (CaCl2), potassium chloride (KCl), and sodium bicarbonate (NaH CO3) (Table 1).
Salt cost The cost of salt in USD for all treat ments was generated by calculating the total cost of each salt mix to reach 15 g L-1 salinity and the percent of each salt used in each treatment. In addition, the cost of salt m-3 and the shrimp production m-3 in each treatment were combined to calculate the cost of salt kg-1 of shrimp.
Experimental design and operation
Shrimp husbandry The shrimp used were purchased from American Mariculture, Inc. (St. James City, FL, USA). Upon arrival, the shrimp were raised in two 3.4 m3 nursery tanks for 37 days before being stocked into the experimen tal tanks. The salinity in the nursery tanks was started at 30 g L-1 and was lowered to 15 g L-1 over the course of the nursery period. The shrimp were fed 6 different rations through out the nursery. The shrimp were fed on 24-hour automatic belt feeders for the majority of the nursery stage to ensure continuous feed availability.
The post-nursery shrimp were stocked into the experimental tanks at 262 shrimp m-3 at an average in dividual shrimp weight of 2.9 g shrimp-1. Throughout the experi ment, the shrimp were fed 3 times daily at 08:00, 12:00, and 16:00 h.
The individual treatments in the experiment were 75/25% LCS/CSS, 80/20% LCS/CSS, 90/10% LCS/ CSS, 95/5% LCS/CSS, 97.5/2.5% LCS/CSS, and 100% LCS. The spe cific brands and purity of each ingre dient of the LCS are listed in Table 2.
There were no significant differences in temperature, TAN, nitrite, TSS, or VSS (p > 0.05, Table 3). Significant differences were detected in DO, pH, salinity, and turbidity between treat ments (p < 0.05). The DO concentra tion tended to increase as CSS concen tration decreased, with 100% LCS and 97.5% LCS treatments having signifi cantly higher dissolved oxygen levels
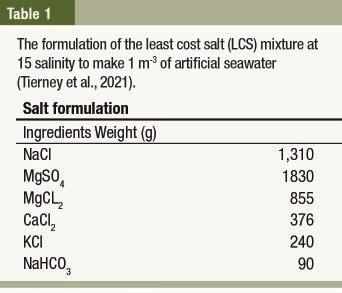

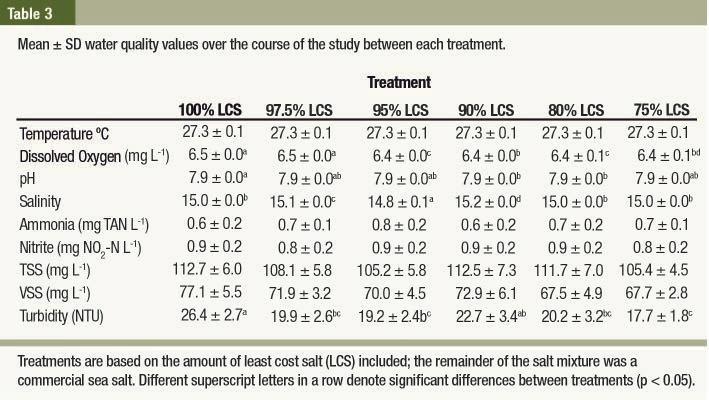
There were no significant differ ences detected between treatments in all tested shrimp production metrics, including average weight shrimp-1, growth rate week-1, FCR, kg of shrimp m-3, and survival (p > 0.05, Table 4). All average shrimp weights were between 20.7 g, and 22.2 g and average growth rates were 1.4–1.6 g week-1, FCRs ranged from 1.4 to 1.6:1, shrimp production ranged from 4.3 to 4.7 kg m-3, and survival averaged 81% across all treatments with a range of 76.7–84.3%.
The lack of significant differ ences in shrimp production between treatments has important implica tions for shrimp producers. The in creased concentration of LCS used in production appears to have no detrimental impact on shrimp per formance. Overall average survival was just above 80%, average FCR was 1.5 across all treatments, and the average growth rate was 1.5 g week-1, all comparable to or exceeding recent shrimp studies using reduced cost salt mixtures and commercial mix tures at similar salinities (Tierney et al., 2021; Galkanda-Arachchige et al., 2020; Pinto et al., 2020). Shrimp in this study reached an average of 21.6 g individually at 86 days, a size that is within the range preferred by con sumers in North America, Europe, and other regions. This production time scale falls within a competitive harvest schedule and the shrimp size is at the highest of the range recom mended by Zhou and Hanson (2017) in their economic model, suggesting that the results of this study are com mercially relevant. These results further demonstrate the utility of this reduced-cost salt mix across several stages of shrimp growth, as the study by GalkandaArachchige et al. (2020) used an identical low-cost mixture and found equal performance of post-larval and juvenile shrimp between both lowcost and commercial salt mixes. The results of this study found use of the LCS resulted in high survival, exceed ing the results in Tierney et al. (2021) who noted shrimp jumping out of the tanks which may have resulted in the discrepancy in shrimp survival. The
Although there were significant dif ferences between treatments in DO levels, pH, salinity, and turbidity, these minute differences likely had little ef fect on the overall performance of the shrimp and were all within ac ceptable ranges. There were no sig nificant differences found between treatments in temperature, TSS, or VSS. Importantly, pH levels were maintained when using the LCS, even though a single source of alkalinity is used in the mixture (sodium bicar bonate). A complete sea salt mixture would likely include multiple buffers, such as calcium, potassium, and mag nesium carbonate compounds.
The cost of salt m-3 at 15 g L-1 sa linity was different between all treat ments, and cost decreased as LCS percentage increased (Table 5). The cost of salt kg-1 of shrimp produced was found to be lowest on average in the 97.5% LCS tanks, and significant ly lower than the 80% and 75% LCS treatments (Table 6). Discussion Total ammonia nitrogen and nitrite levels were both maintained within acceptable ranges for shrimp pro duction throughout this experiment.
»46 JUNE - JULY 2022
One limiting factor in recirculating aquaculture systems (RAS) marine shrimp production is the need for salt to create marine or brackish water.
ARTICLE than the other four treatments. The 100% LCS treatment had significantly lower overall pH than the 90% and 80% LCS treatments. Turbidity was significantly higher in the 100% LCS treatment compared to all other treat ments except the 90% LCS treatment.
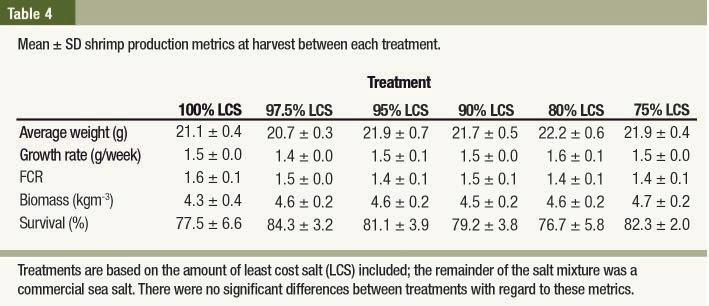
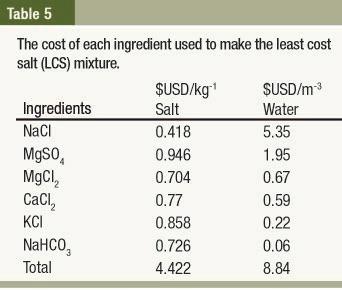
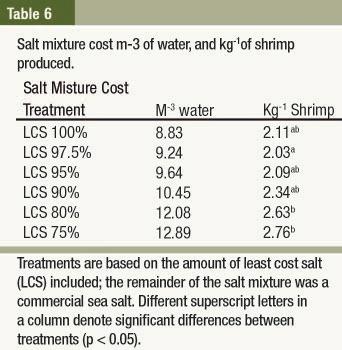
This is a summarized version developed by the edito rial team of Aquaculture Magazine based on the review article titled “USING ALTERNATIVE LOW-COST ARTIFICIAL SEA SALT MIXTURES FOR INTENSIVE, INDOOR SHRIMP (LITOPENAEUS VANNAMEI) PRODUCTION” developed by LEO J. FLECKENSTEIN; THOMAS W. TIERNEY; JILL C. FISK; ANDREW J. RAY- Kentucky State University. The original article was published in AQUACULTURE REPORTS, in May 2022. The full version, including tables and figures, can be accessed online through this link: https://doi.org/10.1016/j.
The salts that were used to make the LCS formulation in this study were each purchased in 23 kg bags that were shipped several hundred ki lometers. However, in a commercial setting it is more likely that farmers would purchase these in bulk quan tities and from local vendors if pos sible. This commercial-scale strategy would likely reduce the cost of the mixture even further. In fact, Maier (2020) points out that scale is one of the biggest factors influencing the profitability of indoor shrimp farm ing. He goes on to note that using the same LCS formulation tested in this study can significantly improve profit potential for farmers.
Although most aquaculture is pond based, indoor aquaculture is growing in popularity, especially in inland areas where fresh seafood products are often difficult to acquire. similar shrimp performance between treatments, regardless of LCS con centration, influences the economics of shrimp production operations.
» 47JUNE - JULY 2022
Conclusion The study shows the feasibility and cost savings of a low cost, easily made salt mixture in high-intensity indoor shrimp production. The use of the LCS mixture should be con sidered by shrimp producers due to the significant decrease in production costs, similar shrimp performance, and water quality compared to a com mercial marine salt mixture.
The cost difference in salt between the 75% LCS and 100% LCS was just over $4 USD m-3, which could lead to significant cost savings for shrimp producers, especially those operating at large scale. The lower salt cost also reduced the cost of production kg-3 of shrimp by $0.75 USD, which rep resents a 15% decrease in production cost over the CSS formulation. The economics of pond-based shrimp farming are well studied; however, the feasibility of high intensity, in door shrimp production is still un clear due to substantial upfront costs and variable system designs and pro duction strategies. Any reduction in production cost may have significant impacts on this relatively new shrimp production style.

Here we present the summary of a study where several models were used to forecast shrimp biomass to determine the appropriate feeding strategy in a RAS. Materials and methods Experimental materials and system Litopenaeus vannamei rearing was car ried out at two corporations in China. As shown in Figure 1a, b, the experi ments were performed at Yujia’ao Ecological Technology (from June to November 2018) and at Guangdong Haimao Investment (from June to December 2019).
Researchers have carried out many related studies on applying empirical models to predict shrimp biomass. However, the models cannot be di rectly applied to a RAS due to the different modes, methods and envi ronments of the rearing process.
Precise feeding in the recirculating aquaculture mode is a critical problem. Accurate prediction of shrimp biomass could determine the appropriate feeding amount and ensure stable water quality. This review presents the development of an intelligent feeding technique in a recirculating aquaculture system for rearing Litopenaeus vannamei
Bourke et al. (1993) developed a decision-making system that could feed back water quality indicators in real time. Novel detection methods and sensors are also constantly being developed. Wang et al. (2018) devel oped a novel optoelectronic sensor device for NO2-N in a recirculating aquaculture system (RAS). The com bination of sensors with the Internet of Things and artificial intelligence technologies has been widely used in aquaculture, making water quality prediction and early warning tech nologies more accurate and smarter.
Figure 1c shows the shrimp reared in a single tank. Two sets of RASs were arranged for 680 thousand shrimp, and the larvae were reared up to 30 mm in length. During the water treatment process, ultraviolet generation and ozone were applied to prevent viruses and pathogens. A dirt collecting de
By: Aquaculture Magazine Editorial Team*
»48 JUNE - JULY 2022 ARTICLE
FEEDING
Researchers have used ma chine learning to carry out a series of studies on early warning and aquaculture strategy formulation. In recent years, the application of machine learning in aquaculture has included predic tion of water quality indicators, early warning of diseases and red tide out breaks, and fish stock prediction.
Compared with the traditional ex tensive breeding mode, RAS is more conducive to sensor applications.
Using sensor technology to moni tor and regulate the culturing process will be the trend in the intelligent fish ery.
INTELLIGENT TECHNIQUE BASED ON PREDICTING SHRIMP GROWTH in recirculating aquaculture system
.
RASs can provide high production as an effective aquaculture approach due to their controlled, bio-secure environment based on an artifi cial ecosystem. It also, can produce high-quality seafood with low water exchange regardless of the external environment.Whiteshrimp (Litopenaeus van namei) cultured in a RAS can grow at high density, avoiding harmful vi ruses. Moreover, a land based system with limited water exchange has great potential to reduce the environmen tal load of a water treatment process (Martins et al., 2010). While shellfish are in a RAS, the reared animals’ bio mass is hard to calculate accurately, especially when the culture tank is large. To guarantee sufficient and ap propriate feed, counting numbers and total weight by sampling a unit area is a common way of measuring biomass (Chen et al., 2019). Accurate estima tion of shrimp biomass in a RAS pro vides significant guidance for feeding. The biomass can determine the appropriate feeding amount, ensur ing clean water quality and provid ing adequate nutrition for shrimp.
In the present study, several ANN methods, including the general re gression neural network (GRNN), backpropagation neural network (BPNN), extreme learning machine (ELM) and recurrent neural network (RNN), were used to develop bio mass prediction models. The sigmoid function was applied in the model de velopment process. GRNN, BPNN and ELM are feedforward neural net works with no cycles or loops.
Support vector machine As an efficient machine learning tech nique principally based on statistical theory, the support vector machine (SVM) focuses on limited informa tion about samples and moves be
Artificial neural networks (ANN) are derived from the biological neural networks in the human brain. Unlike networks with only a few layers of one-directional logic, they use algo rithms to manipulate determination and organization of functions. Inter connected artificial neural networks are usually composed of neurons that can deal with the inputs and follow various situations.
» 49JUNE - JULY 2022 vice was installed to guarantee water quality in each tank. Shrimp were fed on commercial feed six times a day. In the early stage of shrimp culture, the feeding amount was 5%–8% of total shrimp biomass. The feeding amount was diminished with the passage of rearing time and finally reduced to ~3% of total cultured biomass. Fig ure 1d shows a schematic of the RAS. The combination of the centrifugal pump and the oxygenation cone con tributed to the recirculation loop. The centrifugal pump drew water to a high elevation inside the biofilter and then poured water into a pipeline and recir culated it by gravity. An oxygenation cone was combined with a low-flow pump to provide sufficient dissolved oxygen. A disinfection subsystem, in cluding an ultraviolet and ozone gen erator, was able to prevent infection from viruses and other pathogenic microorganisms.
Model optimization
The water environment needs to be regulated based on experience because the shrimp RAS contains a controlla
A genetic algorithm (GA) was used to optimize the machine learning methods, including ELM, BPNN and SVM, in the present study. GA is an evolutionary algorithm used to optimize a data-driven computa tional model with a combination of selection, crossover and mutation to evolve the initial random popula tion. Figure 2 shows a schematic of the machine learning GA (ML-GA).
tween the complexity and the learning ability of models, which possess an extraordinary knowledge of optimi zation worldwide to improve general ization. As for the linear separable bi nary classification, finding the optimal hyperplane that divides all samples with maximum margin is the principal function of an SVM. The plane could improve the model’s predictive capac ities and minimize the errors that are likely to emerge randomly when the statistics are being classified.
The first GA optimization process involves choosing a fitness function that measures the performance of a set of input parameters. A solution with higher fitness derived from the fitness function will be better than any lower-fitness solution. A popu lation is generated, and the appro priate time is taken to process each generation as system costs for cal culating fitness and generating each population. The population goes through parent selection, where the best solutions will be selected to cre ate the next generation of solutions. The parents will then go through the crossover process, and the children generated go through a mutation phase. The survivor selection stage will decide which individuals can move on to the next generation. The whole process will be repeated un til the algorithm converge based on some convergence criterion. Design of intelligent feeding system
Machine learning methods

»50 JUNE - JULY 2022
Results MLR model Water temperature, salinity, pH, DO, TAN, NO2-N and total feed amount were successively introduced into the MLR model. Each variable needed to go through the F-test before be ing introduced into the model, and the t-test was performed on the in troduced variables. When the intro duced variables were no longer sig nificant to the model, subsequent variables were deleted to ensure that the equation contained only signifi cant explanatory variables. Variables were introduced step by step through arrangement and combination to en sure that the obtained equation had the best explanatory power. Finally, an expression with four explanatory variables was constructed as follows:
ARTICLE ble artificial ecosystem. Different lev els of experience will lead to varying regulation results and unstable pro duction. Figure 3 shows the design of the intelligent feeding system. There is a complex interaction between bio mass, feeding amount and water qual ity. The shrimp biomass can directly determine the feeding amount, and water quality is mainly affected by bio mass and feeding amount in a RAS. Therefore, in this study, an intelligent feeding system was designed based on the shrimp biomass prediction model. Machine learning approaches were used to calculate the feeding amount. The embedded system can then read the water quality index measured by the sensor, call the machine learning model and control the feeding ma chine to regulate the feeding strategy in the RAS.

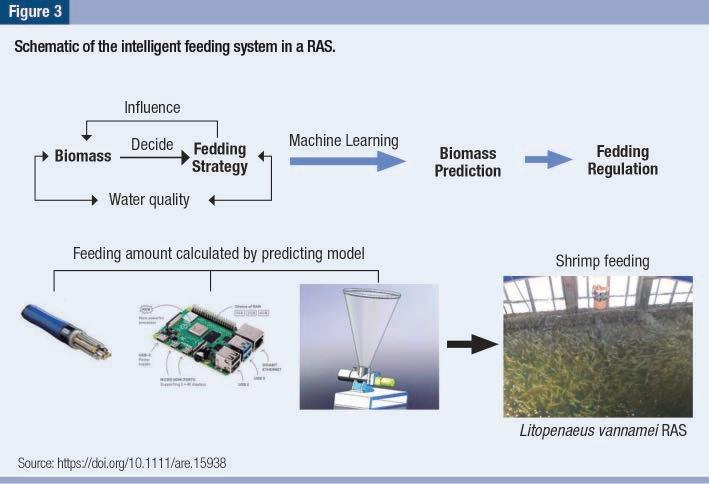
The RMSEs of the LSTM and ELM training sets were much larger, and the predicted results were quite dif ferent from the actual values.
The RMSE showed that the GRNN and SVM model calculation results were accurate and that the prediction ability of the training set was stable.
Figures 5 illustrates
Training machine learning models
The closer a scatter point is to the di agonal, the closer that prediction is to the actual value.
where W represents shrimp biomass (kg/m3), x1 represents water tem perature (°C), x2 represents salinity (‰), x3 represents pH, and x4 repre sents total feed amount (kg/d). The MLR model passed the t-(p< 0.05) test and F-(F = 148.512) test with a regression coefficient (R2) of 0.882.
Predictive performance
Figure 5 shows the actual versus pre dicted values for the test set. X and Y have the same range, and the diagonal represents the regression standard.
The test set contained 22 group data points. The prediction performance was evaluated by preliminary observ ing the degree of overlap between the predicted result and the actual value.
» 51JUNE - JULY 2022
The machine learning methods, in cluding GRNN, BPNN, LSTM, ELM and SVM, were used to develop models. The data set was divided into a 75% training set and a 25% testing set. The training set data were used to develop predicting models, and the test set data were substituted into the models for evaluation and veri fication. Figure 4 illustrates the data distribution curves of the GRNN, SVM, ELM and LSTM training sets.
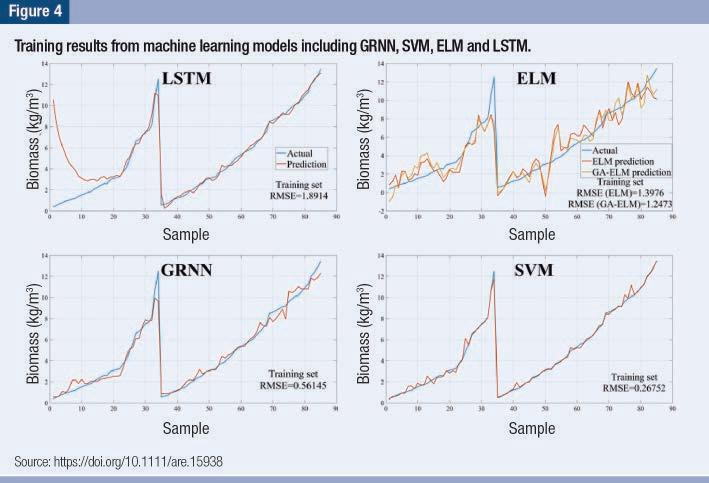
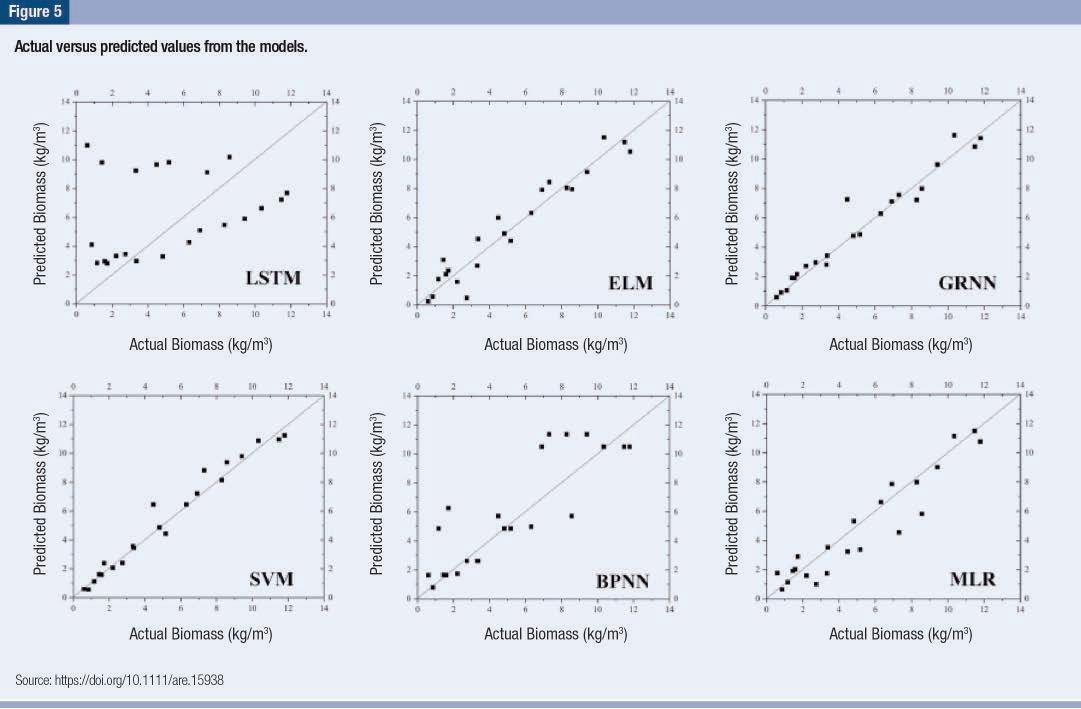
»52 JUNE - JULY 2022 ARTICLE
SVM and GRNN had the highest ac curacy (90.91%), whereas LSTM had the lowest accuracy (22.73%).
This is a summarized version developed by the edito rial team of Aquaculture Magazine based on the review article titled “INTELLIGENT FEEDING TECHNIQUE BASED ON PREDICTING SHRIMP GROWTH IN RECIRCULATING AQUACULTURE SYSTEM” developed by FUDI CHEN and MING SUN - Institute of Oceanology, Chinese Academy of Sciences, Qingdao, China; Qingdao National Laboratory for Marine Science and Technology, Qingdao, China; Dalian Key Laboratory of Conservation of Fishery Resources, Dalian, China, YISHUAI DU, JIANPING XU, LI ZHOU, TIANLONG QIU and JIANMING SUN - Center for Ocean Mega-Science, Institute of Oceanology, Chinese Academy of Sciences; Qingdao National Laboratory for Marine Science and Tech nology, Qingdao, China. The original article was published in AQUACULTURE RESEARCH in MAY 2022. The full version, including tables and figures, can be accessed online through this link: https://doi.org/10.1111/are.15938 that the test set predictions from the SVM and GRNN models were more accurate than those from the other machine learning models. Model comparison Residual plots can be used to estimate whether the prediction errors (residu als) are consistent with the stochastic errors. Figure 6 shows residual plots of the shrimp biomass prediction models. The residual represents the difference between the actual value and the predicted value of shrimp biomass. By analyzing the residual plot, the degree of dispersion of the prediction results can be observed.
Conclusions MLR, ANNs and SVM methods were used to construct biomass prediction models for L. vannamei in a RAS. The MLR method extracted four main explanatory variables: water temper ature, dissolved oxygen, pH, and to tal feeding amount and constructed a linear relationship between shrimp biomass and its main explanatory variables. The model passed the ttest and F-test (R2 = 0.882). Biomass prediction models based on machine learning approaches were developed using the data set, and a genetic al gorithm was used to optimize the models further. Four indices (MAE, RMSE, MAPE and accuracy) were used to evaluate the deviation of the prediction models. SVM was se lected as the optimal shrimp biomass prediction method after comparing the predicted results, residual analy sis and evaluation indices between different models (RMSE = 0.6500, MAE = 0.4368, MAPE = 3.70%, accuracy = 90.91%). Finally, a fastresponding shrimp biomass predic tion model for a RAS was developed using the SVM method with GA optimization. The intelligent feeding system can apply the SVM model to regulate the precise feeding amount in a L. vannamei RAS.
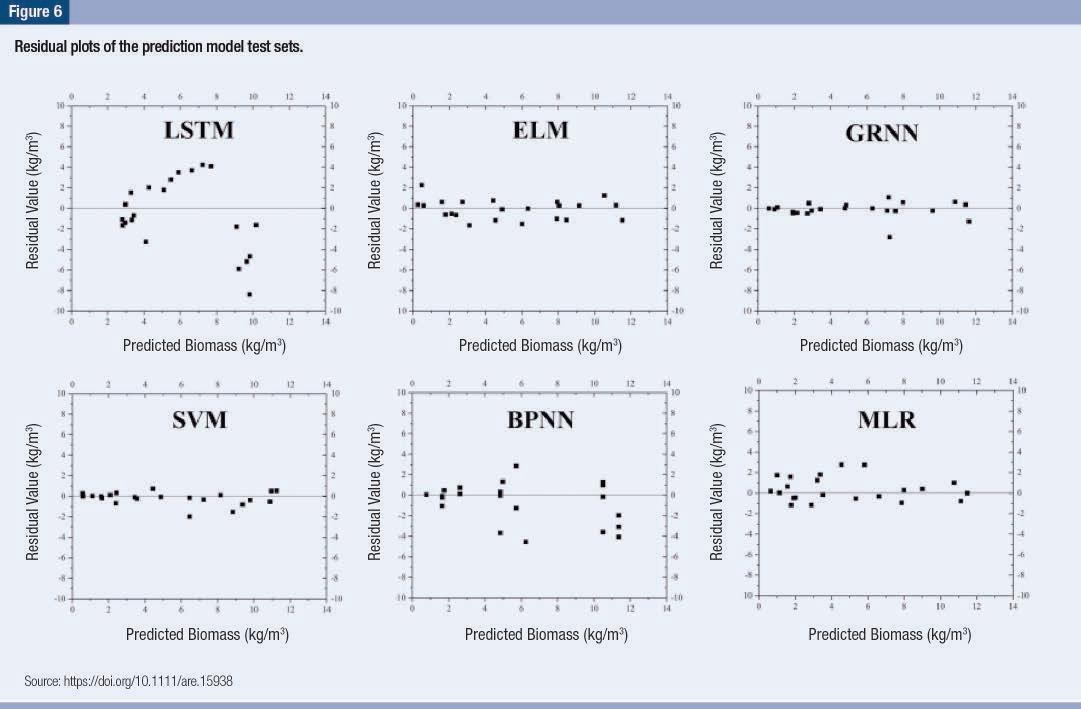
Penaeid shrimp include com mercially important species for aquaculture in Asia and the Americas. The whiteleg shrimp, Penaeus vannamei, is the most economically valuable species and its production reached 4.45 tons, valued at USD 26.74 billion in 2017. Along with the exponential increase in shrimp production, infectious disease outbreaks are major constraints faced by shrimp aquaculture. Most threats to shrimp production worldwide are due to viral pathogens and bacterial pathogens. A range of antibiotic ap plications and other chemical treat ments have resulted in mixed reviews and further concerns for associated negative impacts. Thus, more sus tainable approaches to mitigate these health issues requires new tools in feed formulation that might better prepare the host’s immune system against pathogens. To this end, the addition of various additives includ ing prebiotics, probiotics and symbi otics has recently attracted interest in shrimp aquaculture. Despite the significant progress in probiotic, prebiotic and symbiotic
Evaluation of immune stimulatory products for whiteleg shrimp (Penaeus vannamei) by a metabolomics approach
By: Aquaculture Magazine Editorial Team*
» 53JUNE - JULY 2022 ARTICLE
The use of probiotics, prebiotics, and dietary fiber has become a common practice in aquaculture as an alternative to antibiotic treatment. However, not much is known about the metabolic mechanisms underlying the effects of these products. An evaluation of immune stimulatory products for whiteleg shrimp using a metabolomics approach has shown that the combination of cellulose fiber and probiotics could potentially improve the health and growth of farmed shrimp.
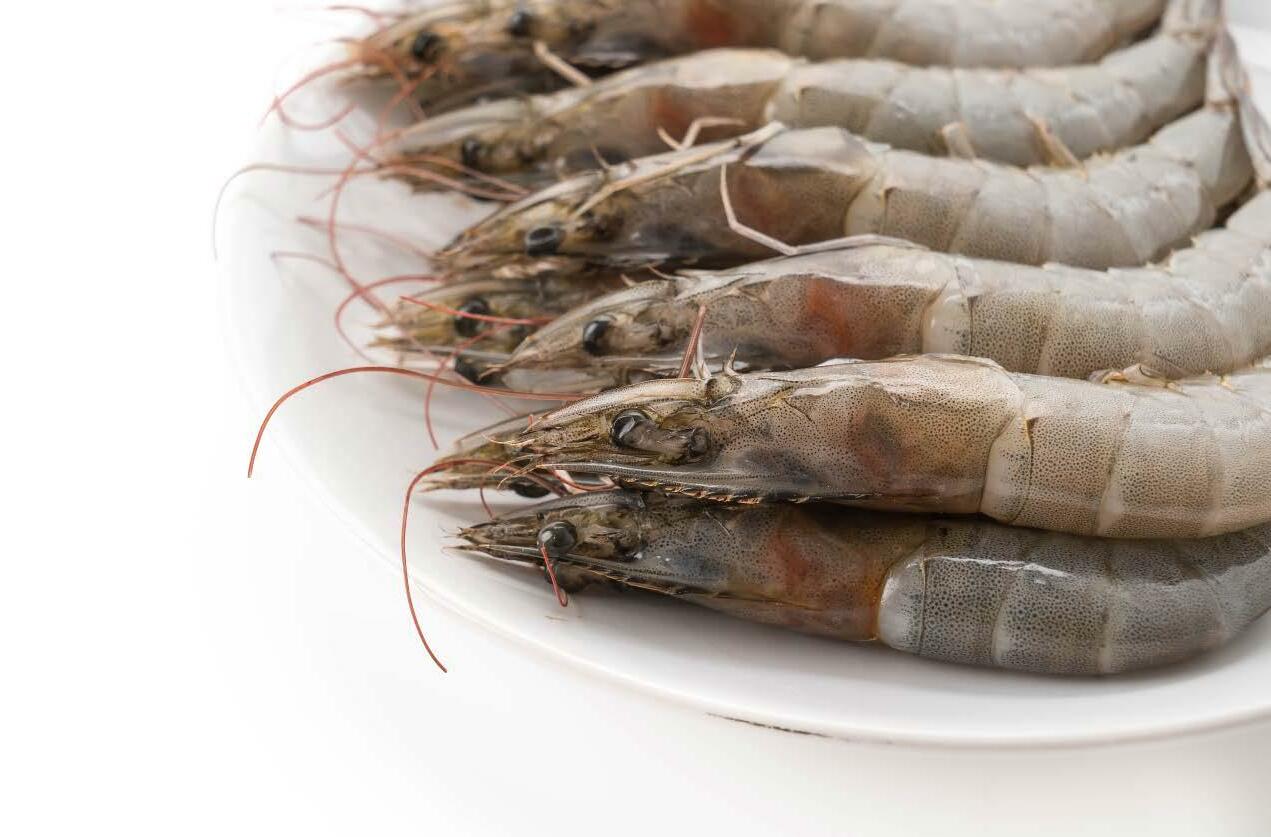
Materials and methods Experimental design
The experimental conditions were maintained for 5 days, after which 9 shrimp from each treatment and control groups were sampled for me tabolomics analysis. Firstly, 200 μL of hemolymph were collected from each animal and placed into a 2 mL cyro-vial and immediately quenched in liquid nitrogen. Then, gill tissues were cut and collected into 2 mL cyro-vials and snap frozen in liquid nitrogen. Metabolomics analysis
»54 JUNE - JULY 2022
The experiment was carried out at the Centro Nacional de Acuicultura e Investigaciones Marinas (CENAIM), Escuela Superior Politécnica del Lito ral (ESPOL) in San Pedro, Ecuador.
Metabolites from hemolymph (200 μL) and gills tissues (5 mg of dried tis sues) were extracted with cold (-20 ºC) methanol-water and derivatized with methylchloroformate (MCF) with minor modifications. D4-alanine (20 μL of 10 mM) was added into each sample before extraction as an inter nal Blankstandard.samples containing only 20 μL of 10 mM d4 alanine were extracted together with samples for quality control (QC) purposes. An other type of QC sample was amino acid mixtures (20 μL, 20 mM) that were derivatized as the protocol for the samples. After derivatization, 10 μL from each sample were pooled to gether to make a pooled QC sample for each tissue. The derivatized samples were analyzed with a gas chromatograph GC7890B coupled to a quadrupole mass spectrometer MSD5977A (Agi lent Technologies, CA, USA) with a quadrupole mass selective detector (EI) operated at 70 eV. The system was equipped with a ZB-1701 GC capillary column (30 m × 250 μm in
Whiteleg shrimp (P. vannamei) (5.7 ± 0.6 g) were obtained from CE NAIM’s Experimental Station (Santa Elena Province, Ecuador) and were acclimatized in the lab for five days. After acclimation, 10 animals were transferred into each of 40 L tanks assigned as control, cellulose fiber, probiotic and mixture of plant fiber and probiotic (ProFib) treatments (Table 1). For shrimp in the cellulose fiber treatment, the commercial feed (Skretting, 35% protein) was supple mented with a commercial cellulose fiber (Sigmacell® Cellulose, SigmaAldrich, USA) at a concentration of 100 mg· kg-1. The V. alginolyticus (ILI) probiot ics was administered by immersion in the water to reach a final concentra tion of 105 UCF· mL-1 in the PB and FB treatments. In the third treatment (ProFib), shrimp were cultured with a combination of plant fiber supple mented feed and probiotic enriched water as described above. Animals in the control tank were only fed with commercial feed without the addi tion of cellulose fiber or probiotics. All animals across control and treat ments were fed at 5% biomass. The probiotic bacterial strain V. alginolyticus (ILI) was used in this ex periment for the probiotic treatment. For this purpose, the ILI strain was activated in Petri dishes with Trypti case soy agar and 2% ClNa (TSA + 2% ClNa). The plates were incubated at 28ºC for 24 h. Individual colonies were transferred to LB Broth (ratio 4–5 colonies per 100 mL), and incu bated at 28ºC with constant move ment (110 rpm) for 12 h. After the incubation period, the bacterial culture was centrifuged at 4000 g for 10 min at 4ºC, and result ing microbial pellets were resuspend ed in seawater and stored at room temperature (25ºC). The final con centration (CFU· mL-1) and bacterial viability were determined by plating the bacterial suspension in marine agar. Finally, the microbial pellet was resuspended in sterilized seawater and stored at room temperature for later use.
Sampling
ARTICLE studies in shrimp aquaculture, the molecular processes underlying the mechanisms of their efficacy remain unclear and need further investiga tions. To this end, metabolomics, the study of small molecules (metabo lites), is an innovative tool of great applicability to elucidate these com plex dynamics. The application of metabolomics in aquaculture has just emerged within the last decade and is being applied in fields such as immu nology and disease, environmental stress and eco-toxicology, post-har vesting and diet optimization. No gas chromatography - mass spectrometry (GC- MS)-based me tabolomics studies have been re ported for probiotic, prebiotic (or cellulose fibers) and symbiotic inves tigations in shrimp farming. In this study, it is applied a GC- MS-based metabolomics approach to compare metabolic responses in hemolymph and gills of whiteleg shrimp (P. van namei) exposed to different immune stimulatory products, including a cellulose fiber, Vibrio alginolyticus as a probiotics and the combination of the cellulose fiber and probiotics. It is envisaged that findings herein will contribute to the development of efficient immune stimulation treat ments in shrimp aquaculture.
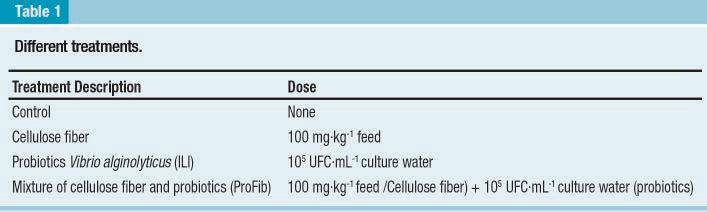
The Automated Mass Spectral De convolution and Identification Sys tem (AMDIS) analysis yielded 81 targets from 416 components for both hemolymph and gill tissues. After annotation, there were 84 and 81 metabolites annotated in hemo lymph and gill, respectively. These compounds belong to major catego ries including amino acids, fatty acids, organic acids and others.
Metabolic responses of hemolymph to immune stimulation
Metabolite profiles of hemolymph and gills
The Principal Components Analy sis (PCA) score plots showed a clear separation between the combined treatment and the control (Figure 1). However, there were not clear sepa rations among the control, cellulose fiber and probiotic treatments. There was some overlap in distri bution of the combined treatment, cellulose fiber and probiotic treat ment. Similarly, supervised Partial Least Squares - Discriminant Analy sis (PLS-DA) did not show a good discrimination between the control and the cellulose fiber treatment, but the separation between the con trol and the probiotics were clearer than that in the PCA score plot. The distribution of the combined treat ment was clearly discriminated from the control and the cellulose fiber. A one-way ANOVA analysis revealed 27 metabolites that differed among these groups. A heatmap of these metabolites shows the details of these differences (Figure 1), which indicate that most of the differences among groups relate to elevated metabolites in the combined treatment compared to the control. The probiotics showed higher levels of 5 metabolites (methi onine, malonicacid, 2-maninoadipic acid, tryptophan and phenylalanine) and slight increases of 6 other com pounds (myrisric acid, palmitelaidic acid, dodecane, cis-aconitic acid, ala nine and lactic acid) compared to the control. Similarly, the cellulose fiber treatment differed from the control with strong increases of 3 metabo lites (itaconic acid, levulinic acid and dodecanoic acid) and slight increases of 6 other compounds (margaric acid, trans-vaccenic acid, heptadec ane, pentadecanoic acid, myrisric acid and palmitelaidic acid).
» 55JUNE - JULY 2022 ternal diameter × 0.15 μm film thick ness with a 5 m guard column) (Phe nomenex, Torrance, CA, USA).
Results


»56 JUNE - JULY 2022 ARTICLE A pathway analysis was per formed only between the combined and control groups, since these were the only groups with clear separation in metabolite profiles. The results re vealed 34 pathways involved in this separation. After filtering (impact factor > 0, p ≤ .05, hits ≥ 2), only 6 pathways were found to have signifi cant alterations due to the combined treatment (Figure 2). Metabolic responses of gills to im mune stimulation The metabolite profiles of gill tis sues did not show clear separation among the treatments via PCA score plot, except for a slight separation with some overlap between the con trol and the combined group (Figure 3A). When the PLS-DA analysis was performed, there was a slight sepa ration between the control and com bined group, as well as between the control and the probiotic group, but not between the combined and the probiotic groups (Figure 3B). Simi larly, no separation between the cel lulose fiber group and the control was observed in the PLS-DA score plot. Consistent with the cluster analysis, a one-way ANOVA revealed only lactic acid as significantly dif ferent among the groups (p < 0.05), which was significantly higher in the probiotic treatment than other treat ments (Figure 3C).

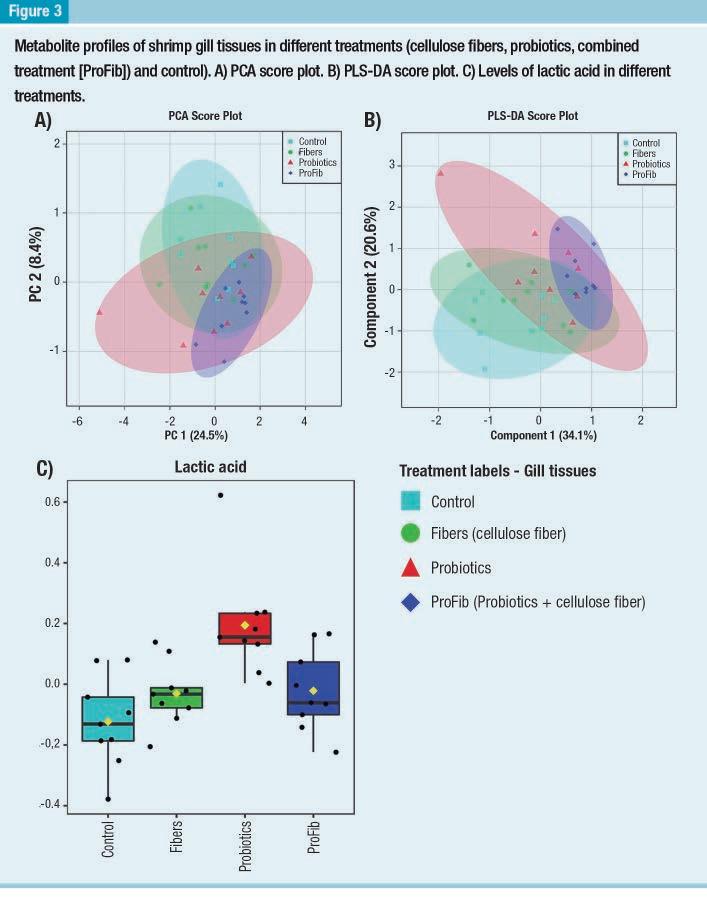
Differences in metabolite profiles of shrimp hemolymph and gill tis sues revealed significant effects of the cellulose fiber and probiotics on shrimp. While the gill metabolite profiles showed a significant differ ence only in lactic acid among the treatments, those of hemolymph re vealed alterations of 27 metabolites. The hemolymph metabolite profiles of individual cellulose fiber and pro biotic treatments showed little differ ence compared to the control, while the combined treatment showed a remarkable difference compared to the control and the other single stim ulant treatments. This suggests that the best immune stimulation can be achieved with the combined applica tion of the cellulose fiber and probi otics. In agreement with this finding, previous shrimp studies have also shown that the combination of cellu lose fiber and probiotic yields higher immune responses and survival of L. vannamei against infections, compared to the individual treatments with ei ther probiotics or prebiotics (Arisa, et.al., 2015 and Huynh, et al., 2018).
» 57JUNE - JULY 2022
This is a summarized version developed by the editorial team of Aquaculture Magazine based on the review article titled “EVALUATION OF IMMUNE STIMULATORY PRODUCTS FOR WHITELEG SHRIMP (PENAEUS VAN NAMEI) BY A METABOLOMICS APPROACH” developed by ANDREA C. ALFARO - Auckland University of Technology, New Zealand; THAO V. NGUYEN - Auckland University of Technology, New Zealand and Nguyen Tat Thanh Uni versity, Viet Nam; JENNY A. RODRÍGUEZ, BONNY BAYOT, CRISTOBAL, DOMÍNGUEZ BORBOR and STANISLAUS SONNENHOLZNER - Escuela Superior Politécnica del Litoral, ESPOL, Centro Nacional de Acuicultura e Inves tigaciones Marinas, CENAIM, Ecuador; AWANIS AZIZAN and LEONIE VENTER - Auckland University of Technology, New Zealand. The original article was published in FISH AND SHELLFISH IMMUNOLOGY in DECEMBER 2021. The full version, including tables and figures, can be accessed online through this https://doi.org/10.1016/j.fsi.2021.12.007link: ROC curve analysis of itaconic acid and lactic acid Classical univariate ROC curve analy ses revealed that the AUC of itaconic acid in hemolymph and lactic acid in both hemolymph and gill tissues had very high values of more than 0.91 (Figure 4). These results suggest that itaconic acid and lactic acid could be important and accurate biomarkers for classification and prediction mod eling.
Conclusions
Discussion This study provides the first GC− MS-based metabolomics investiga tion on immune stimulation of cel lulose fiber (plant fiber), probiotic (V. alginolyticus) and a combined treat ment of cellulose fiber and probiot ics for whiteleg shrimp (P. vannamei).
This evaluation demonstrates the ap plication of metabolomics to reveal insights into the metabolic respons es of shrimp exposed to different immune stimulation products. The combination of cellulose fibers as immunostimulant and V. alginolyticus as probiotics provided a better stimu lation than the single stimulants and the control. The study results suggest that the combination of cellulose fi bers and probiotics could potentially be used in aquaculture to improve the health and growth of farmed shrimp. To this end, there is a need for fur ther experiments to investigate the long-term effects of the application of this stimulant on shrimp growth and host responses to pathogen chal lenges. Among the altered metabo lites, lactic acid was increased in both hemolymph and gill tissues in shrimp exposed to the combined treatment, but it was the only altered metabo lite in the gill tissues of the probiotic treatment group. This suggests that lactic acid may be a highly sensitive metabolite and it could potentially be used as a stress biomarker for shrimp farm management.
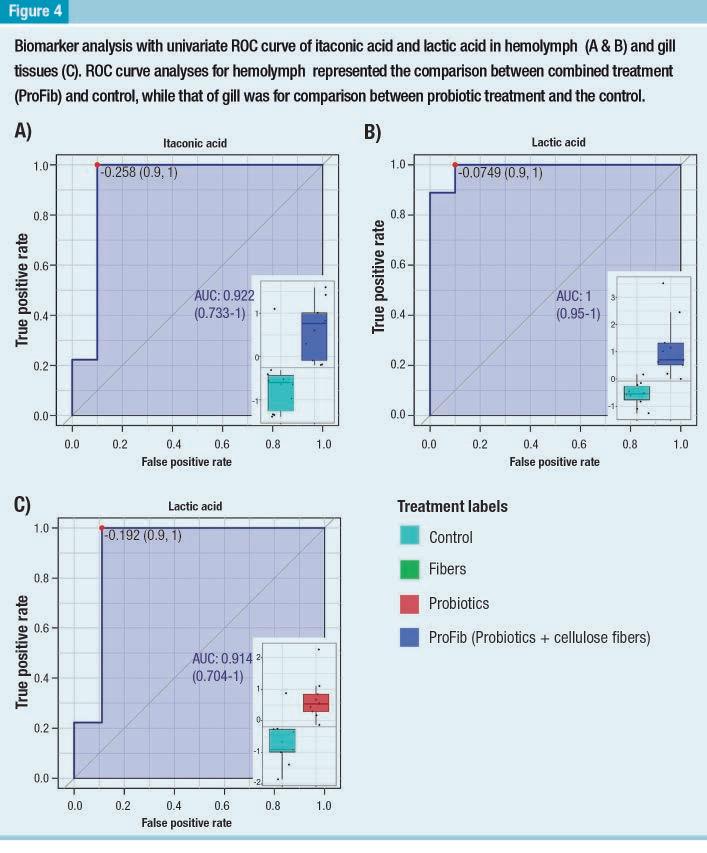
Media for all kinds…
TECHNICAL GURU
As discussed in previous articles, sand filters with sand were designed to be used with systems where the water is chlorinated. Most, if not all, of our systems contain live animals which makes it impossible to have chlorinated water. This is the main reason to look at alternative media choices when using these filters.
Another consideration for any of the media choices is the recommend ed filter rate and how that interacts with biologically active water. Most filter manufacturers recommend fil ter flow rates of up to 20 gpm/ft2 and backwash rates of 23-25 gpm/ ft2, again with chlorinated water. For our industry, filters should be derated by as much as half. Meaning a filter rated at 100 gpm for a pool should be considered for 50-60 gpm in an aquatic system.
Traditional Sand Traditional sand is a silica-based sand. Multiple grades are available to use however, the most popular is the #20 sand. Sand is generally used in conjunction with a coarser grade be low the laterals as a support material.
»58 JUNE - JULY 2022
Most applications that we see are pea gravel which measures 3mm to 6mm diameter. The “#20” refers to the sieve size used to separate the sand grains. Standard measurement for this size sand is 0.45 mm to 0.55 mm. The rule of thumb for particle capture rate for sand is 20 micron.
Of course, we have seen situations where sand can capture finer parti cles. All that said, sand media, while inexpensive, is prone to clumping and clogging. Sand is also prone to colonization of bacteria and zoo plankton. If it isn’t maintained often and properly, it can very quickly be come difficult to work with and inef fective. In our experience, this isn’t the best solution but will work if it is all that is available.
So you have a filter and you’re wondering what to use inside it. The answer depends on what results are needed with the filter. There are several options for media that can be used in a tradi tional sand filter. In the past, we have reviewed the differences between fil ters, now we will dive into the medias. The efficiency of each style of media depends on its chemical make up, size and shape as well as the type of waste that is being captured. All of these characteristics help deter mine the void space, the backwash efficiencies and the way the waste is detained in the filter. It is also important to understand that the depth of the media plays an important role in filter efficiencies and how the media performs. The deeper the bed, the better the filtra tion. This is true of all medias that we have used over the years.
By: Amy Stone* So you have a filter and you’re wondering what to use inside it. The answer depends on what results are needed with the filter. In the past, we have reviewed the differences between filters, now we will dive into the medias.
Mixed Media Mixed media has been a magic bul let for years as an alternative to tra ditional sand. It usually has three or more types or sizes of media. Some media types include crushed garnet, pea gravel, anthracite, activated car bon, sand and more. The concept is that with the different types and sizes of media, it will be more efficient in capturing the waste stream than just one type of media. In some cases, the mixed media is meant to handle more than one process in the same vessel. In terms of efficiency, it is whol ly dependent on the types of media chosen for the filter. Unfortunately, due to the many options out there,
it is nearly impossible to describe the desired effect from using it in a system. It is also biologically active which allows for bacteria and zoo plankton to colonize.
Plastic bead media can be used in sand filter vessels. It is available in both floating and sinking types. If the sand filter is to be used in a tra ditional manner with plastic beads, then sinking beads are the only option. Floating beads are used when the flow is reversed through the fil ter and requires a modification to the internal plumbing. Plastic beads can filter to about 30 microns depending on the size and shape of the bead. They also allow for bacteria growth. They are com monly used in situations where finer particle filtration is not needed.
Non activated crushed glass is a less expensive alternative but due to the fact that all colors of glass are in cluded, the media can allow bacterial colonization.Nomatter what media you choose, it is always good to look at the appli cation and find what works best. Not all medias are created equal.
Amy Riedel Stone is President and Owner at Aquatic Equipment and Design, Inc. She was formerly a Manager at Pentair Aquatic Eco-Systems, and she studied Agricul ture at Purdue University. She can be reached amy@aquaticed.comat
» 59JUNE - JULY 2022
Crushed glass media is getting more popular. It is environmentally friend ly in that it is usually made from re cycled glass. There are several manu facturers that supply this media with various configurations. Standard crushed glass would consist of all types of recycled glass. The efficacy depends on the purity of the glass that is included in the mix. It can be as rudimentary as all sizes of glass particles in the mix or more standardized where the glass is graded out to match a similar profile to traditional sand and gravel. For instance, there is activated glass media which uses only green and brown glass. This style media is known to have a negative charge which attracts the waste particles to the surface of the glass. One manu facturer uses a proprietary process to enhance the negative charge which helps increase the efficiency of par ticle capture. This particular glass media can capture particles down to 4 micron and lower. They also have a hydrophobic version of the media which can filter to less than 1 micron in a single pass. This media can also be used to remove heavy metals. The upside to this media is that it does not allow bacteria to colonize on its surface as long as it is maintained properly. For situations where bacte rial removal is needed, this is an inex pensive option. It also uses less water in the backwash process. Typically, this media only needs one and a half to two filter volumes of water for 90% of the waste to be released. There are specific parameters for backwash and filter rates for this media.
Plastic Bead Media
Crushed Glass Media
If Christopher Columbus had not been convinced that he would find a new way to the Far East, if the Wright Brothers had not believed that they could build a machine that would allow us to fly, or if Tomas Alba Edison had not tirelessly tried to create light through electricity, the history of this world and the way we live would look very different.
By: Antonio Garza de Yta*, Ph.D.
IT IS TIME TO THINK BIG OR DIE TRYING!
»60 JUNE - JULY 2022 CARPE DIEM
M ankind is what it is to day because there are people who thought big, who had confi dence, and who fought against all odds to make their dreams come true. Today I believe that aquaculture needs people like this who are con fident, committed, and persistent. A few days ago I was asked what made the difference between some coun tries and others in aquaculture. At the time I could not give a clear answer, now after thinking about it seriously, I think that the great virtue of some countries was to think big. I remember visiting Ecuador in 2011 when people started talking about “the best shrimp in the world.” At the time, many were incredulous that such a campaign could work, but the National Chamber of Aqua culture, which integrates the entire value chain, took the reins, and as a whole, as a country, they began to believe that they would gradually be able to become the producer of the best shrimp in the world. Today, I believe that their shrimp, if not the best, is one of the best. It is impres sive to see how this dynamic of be lieving in themselves has led them to produce more than a million tons of shrimp and export more than five billion dollars a year. Whatever it is, Ecuador is where it is today because they dared to dream, have faith and worked hard to achieve their vision. We can only applaud them and try to follow their example.
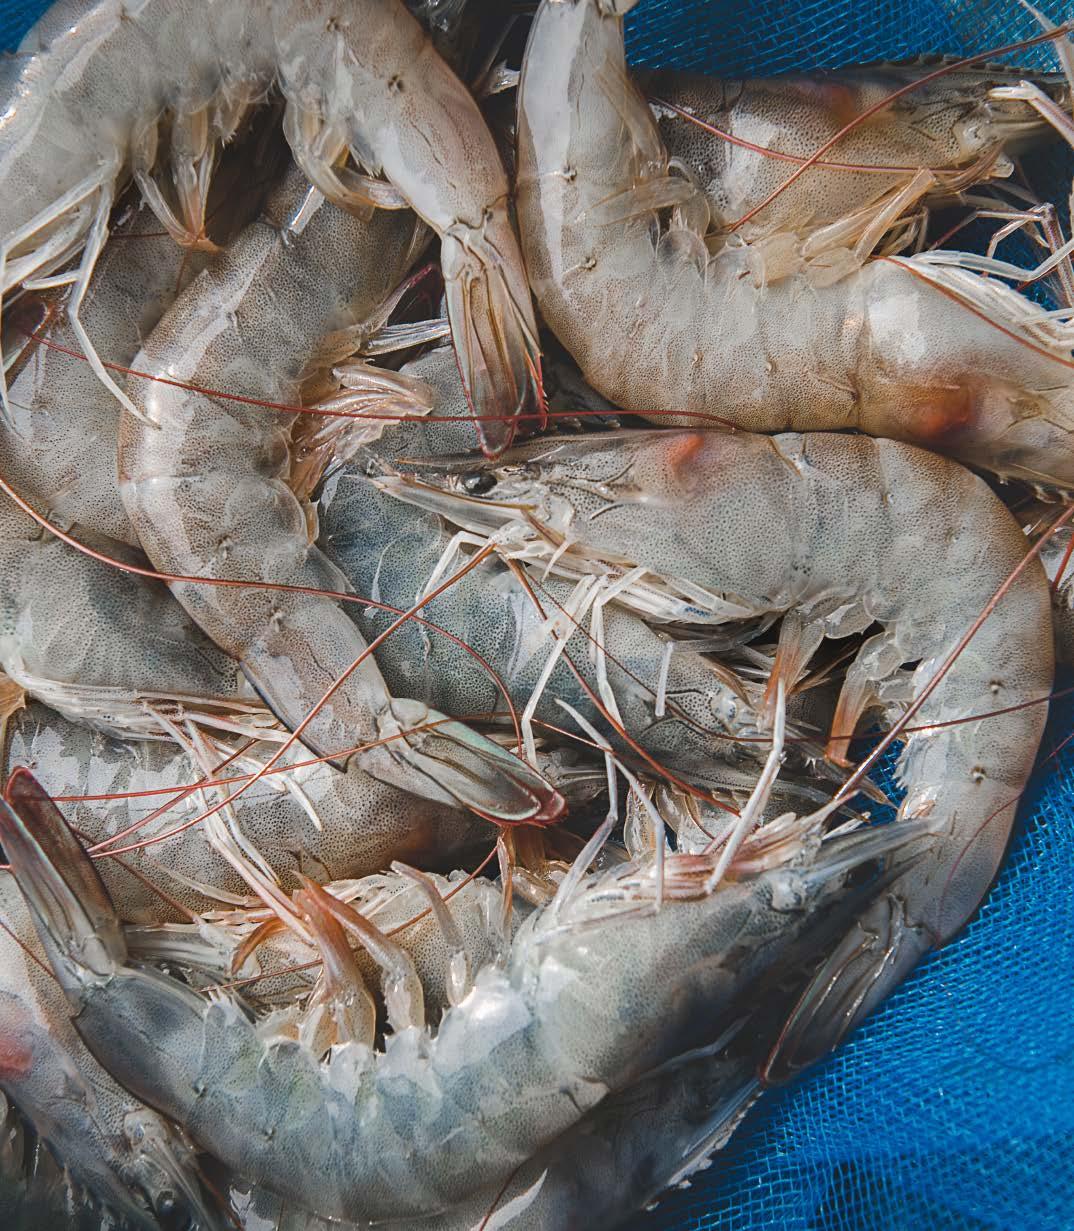
WAS President 2021 - 2022. Antonio Garza de Yta, President, Aquaculture without Frontiers (AwF), a renowned international aquaculture professional, who holds a Masters degree and a Ph.D. in Aqua culture from the University of Auburn, USA. He is an aquaculture expert, FAO frequent consultant, as well as a specialist in strategic planning. Ex-director of Extension and International Training for the University of Auburn and creator of the Certification for Aqua culture Professionals in that academic institution.
Other countries such as India, Brazil, Indonesia, and Egypt have also believed in themselves and increased their production signifi cantly, but from my point of view, the future of major developments in aquaculture technology will now be in the Middle East. I am very pleased to note that both Saudi Ara bia and the United Arab Emirates and Oman attach particular impor tance to aquaculture and have added it to their priorities at the country level, allocating large investments and budgets to get something going that is part of national security for them: contributing to food security by producing high-quality animal protein in the most feasible way. We need to pay very close attention to what is coming in this region of the world.We see the other side of the coin in countries like Mexico, where it is simply not seen how or when the activity will be ignited. There is no vision, no strategy, and not will. Hopefully, the commitment made in the Shanghai Declaration will be fulfilled to make this activity a real priority at the national and regional levels. But, to be quite honest, Mex ico is not the only country that is experiencing this situation, even if it is the one that pains me the most because it is the one that is closest to my heart. This huge group of countries must dare to believe in themselves, to work as a team and not accept the stories that they are a poor country or that progress is not needed to be happy. ¡In a world that is increasingly trying to divide us, we need to be united now more than ever! The countries that want to realize aquaculture must, yes or yes, dream, dare, cooperate, work as a team, give everything. ¡It is time to think big or die trying! The future of major developments in aquaculture technology will now be in the Middle East.
» 61JUNE - JULY 2022


Getting at exact production numbers is not straight forward as these rely on what the government is reporting which in turn relies on the methods used to determine the numbers as well as in some cases a bit of creative num ber crunching. When there are high levels of domestic consumption this can skew the numbers somewhat. It is easier to track exports. Thus, there are a range of figures that are being reported. Two species make up most of the production with one, Penaeus vannamei, the white shrimp being a bit under 80% or more of the total. P. monodon, the tiger shrimp makes a little under 20% or so. A half dozen other species make up the remainder.
By: Ph.D. Stephen G. Newman*
»62 JUNE - JULY 2022
9 The impact of disease is reduced to the point where it does not cause economically significant losses and when it does occur it is contained and cannot spread globally.
9 It must be profitable and with no exploitation of labor.
The tonnage of shrimp produced by aquaculture is at an all high with no end apparently in sight. Have we achieved sustainability or is this another peak that will end abruptly followed by a significant drop in production only to rebound once more?
9 Production is readily kept at steady levels and when it is in creasing it is done in a manner that ensures that this growth rate can persist.
Feed is made from recycled in gredients.
9 Ideally the cycle is closed with no to little waste. Offal is used as fertilizer or as a raw material for feed ingredients (where per missible). Waste streams are used in some manner that is ecologi cally neutral at best (i.e. no nega tive impact on the environment).
THE GOOD, THE BAD AND THE UGLY
9 There is no damage to the envi ronment from the process. Re sources must be used in a manner that ensures that one’s descen dants would be able to operate in the same manner with similar outcomes.
What exactly does sustainability mean and how would this be applied tofarming?shrimp
The word sustainable has become a commonly used and abused term, much as the terms “green”, “eco”, “organic”. What exactly does sustain ability mean and how would this be applied to shrimp farming? There are several components to true sustain ability. These are not intended to be all inclusive but are focused on the highlights.
Is shrimp farming sustainable in its current form?
Table 1 show the reported figures for the main producers for the pe riod 2020 to 2021. Most production still takes place in SE Asia and even though Ecuador is doing very well with no sign of slowing down, the super high density production para digms that many feel will eventually become the norm in most areas in SE Asia are ultimately more profitable and less costly in the long run. But are they sustainable? The production paradigm in Ecua dor has been pretty much the same ba sic model, stocking at low densities in large ponds, 8 to 10 ha average, since its inception. The last few years have seen a change in that stocking densi
Diseases are the costliest single factor affecting profitability and consistent growth and sustainabilitythus ties have increased in some instances, doubled, and even tripled; aerators are in much wider use as are automatic feeders that ensure less wasted feed. Greater attention is being paid to the environment by the use of in-situ bio remediation of organic matter. Ge netically improved animals that grow to marketable sizes quickly are part of this successful formula as well. In SE Asia only a few decades ago the common model was dirt lined ponds with some aeration and stock ing at moderate densities. As these systems have failed repeatedly over the years, they have evolved in a rela tively short period of time to lined ponds, small, frequently under 5,000 m2 with sumps that collect much of the organic matter. Super high densi ty, very small ponds are common. In some cases, tanks have replaced small ponds. Bioremediation is in use as are genetically improved animals. It is safe to say that global totals are at least 5 million MTs and could range close to twice this much. If one looks at these countries individually, sustainable shrimp farm ing, as defined above, is not here yet. Production is increasing and in gen eral is volatile historically. Supply and demand are elements of this but so are controllable factors. Diseases are the costliest single factor affecting profitability and consistent growth and thus sustainability. Producing large numbers of animals in aquatic ecosystems where stressors are com mon, and pathogens may abound due to the open nature of the system ensures animal health challenges. Re cent technological advances suggest that there are large numbers of un characterized invertebrate viruses in these environments. There are many as of yet other non-characterized po tential pathogens waiting for the right
» 63JUNE - JULY 2022
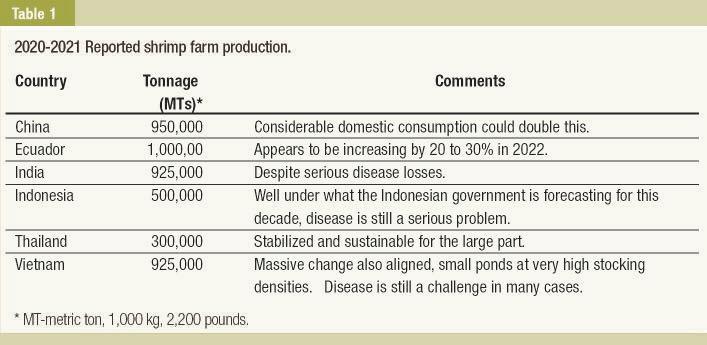
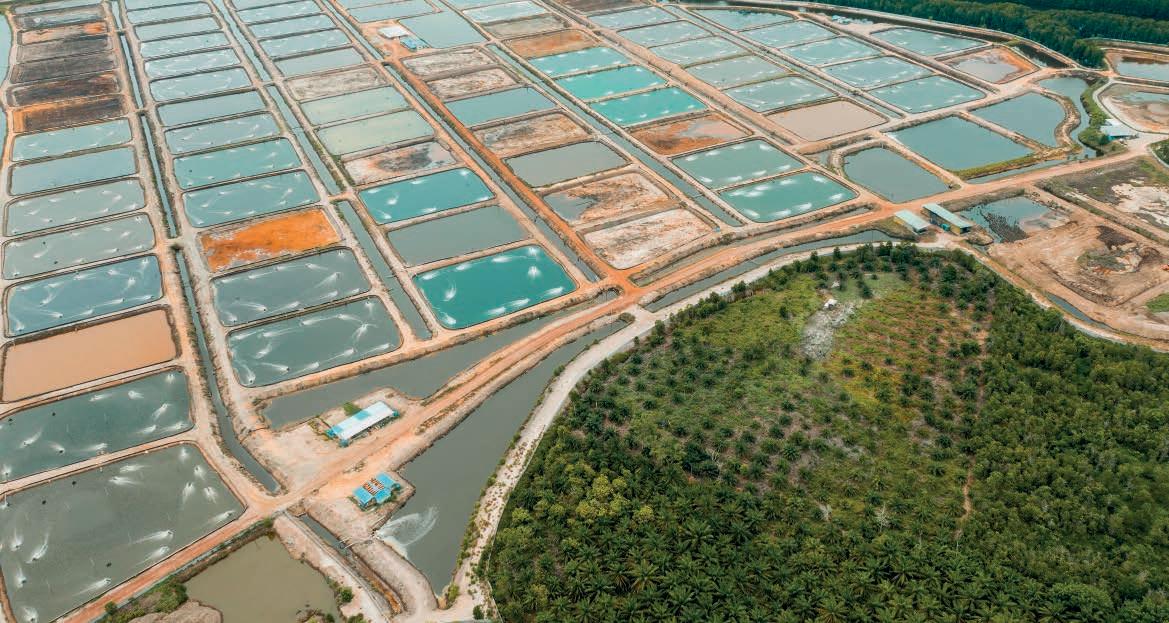
Stephen G. Newman has a bachelor’s degree from the University of Maryland in Conservation and Resource Management (ecology) and a Ph.D. from the University of Miami, in Marine Microbiology. He has over 40 years of experience working within a range of topics and approaches on aquaculture such as water quality, animal health, biosecurity with special focus on shrimp and salmonids. He founded Aquaintech in 1996 and continues to be CEO of this company to the present day. It is heavily focused on providing consulting services around the world on microbial technologies and biosecurity
THE GOOD, THE BAD AND THE UGLY
Although some NGOs and govern ment agencies require that effluent be held in sedimentation ponds with discharge only allowed after the wa ter quality has reached the desirable point, this is rarely a consistent fea ture of production.
»64 JUNE - JULY 2022
At the moment the industry is seeing unprecedented differences in the supply of reefers for transport ing frozen shrimp to processors and ultimately to the customers. Contain ers from SE Asia to the USA and EU are in the $15,000 to $20,000 range, contrasted with those from Ecuador being in the $6,000 range. This dif ference is enough to give Ecuador a price advantage beyond what they already have. This should have a dra matic impact on the export rates of severalSupplynations.and demand certainly im pact sustainability. From my perspec tive, the industry is moving towards sustainability although on a global basis we are still not there. Continu ing to rely on wild animals, the lack of appropriate environmental regula tion and enforcement and in general a disorganized approach towards the development of new farms all con tribute to the current lack of sus tainability. Some countries are closer than others although for the most part the global industry is still many years away from being considered to be truly sustainable.
www.sustainablegreenaquaculture.comwww.bioremediationaquaculture.comsgnewm@aqua-in-tech.comissues.www.aqua-in-tech.com environment to march through weak ened populations. The single largest source of potential pathogens is in post larval shrimp that have not been produced under biosecure condi tions. This is not to say that the pres ence of vectors, cross contamination and fomites do not contribute as well. Specific pathogen free (SPF) shrimp were developed as a response to this threat many years ago with mixed success. There are many holes in what many shrimp hatcheries think are absolute biosecure operations. Nucleus breeding centers are becom ing more common. Nonetheless, the manner in which some broodstock producers work lends itself towards problems. Among these and dis cussed previously are the use of nonbiosecure feeds. Cost is more impor tant than biosecurity although the true costs of stocking infected PLs far exceeds the costs of using bios ecure sources of feeds. They test on a population basis for OIE pathogens with PCR, a tool that is not in of it self sufficient to declare a population as being SPF. PCR is used statistically despite the fact that technologies are available which allow individual broodstock to be screened for all known pathogens quite economical ly. Following the history of animals’ post stocking is essential for deter mining the adequacy of PCR testing. This entails closely following what is happening in the field ensuring that when disease outbreaks occur that some understanding of where the pathogen(s) came from is important. This feedback is essential for true sustainability. Diseases are readily moved between farms by birds and other vectors. There are still many areas where one farms effluent is un treated influent for neighbors. Many farms still discharge raw untreated effluent into the envi ronment. Some collect it in sedi mentation ponds before discharge.
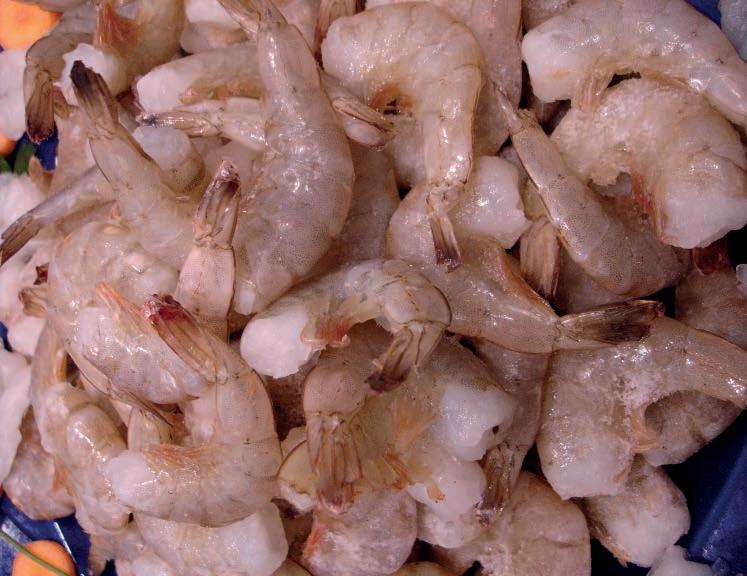
DO NOT PANIC… PLAN YOUR SURVIVAL THE FISHMONGER
If you think you are going to sit still and do nothing, and busi ness will continue without any change then The Fishmonger wishes you every success… but even if you only have one eye open you will realize now is the time to get your survival guide ready for the bumpy ride into the future!
9 According to a recent survey these are the issues all busi nesses will face now and into the near future: Changing Business Trends and Hyper-competition - The COVID-19 pandemic in fluenced every niche and sig nificantly increased competition among businesses across all in dustries. Business strategies need to be re-evaluated to ensure your pathway to success is right or you need to find new revenue gen eration opportunities. The rapid transformation can bring pros perity to agile companies while overthinking, conservative lead ers are left behind.
9 Supply Chain Slowdowns - One of the top business challenges is overcoming supply shortages and late deliveries. This is especially affecting supply chains in North America, Australia, and Europe. As supplies become scarcer, pric
»66 JUNE - JULY 2022
By: The Fishmonger* Wherever you are in the world you are not able to avoid the way things are changing. Unfortunately, disruption in so many of the business drivers are impacting pressures daily for all organizations and solutions must be found for survival.
9 Mental health has entered the equation for managing employ ees. That means employers need to be more mindful of mental well-being in the workplace. El evation of stress levels through increased multitasking contrib utes to workplace deficiencies in terms of more paranoia, re duced focus, diminished loyalty, and decreased productivity. Small businesses must be particularly concerned about attracting and nurturing loyal talent due to limit ed resources so think about what makes your business different.
The practice of management ac counting (the process of gathering and analyzing data) will help you to keep your business afloat and healthy. Develop metrics for tracking pro ductivity and understanding which processes and products are most beneficial to your bottom line. Learn to recognize patterns, make improve ments, and then track the results of these innovations. Many small busi
9 Investing in New TechnologyIn a tough economy marketers need to implement survival strat egies designed to help them sur vive and thrive. Most importantly, a tough market is not the time to stop communicating through effective promotion as much as this is the first thing people do to cut costs. Increasingly there is the growing threat of cybercrime and data privacy risks. This increased complexity creates significant op erational challenges whether you are a global company expanding into new markets or a small busi ness in a country town.
To ensure day-to-day business sur vival, it is important to have an ongo ing understanding of what is going on in your operation. This requires a careful balance between hands-on management and delegating crucial decisions and tasks to people you trust to do them well and keep you informed about developments and challenges.Staying on top of your account ing is especially important. Whether or not you do your own accounting, you should be able to understand and interpret basic financial state ments such as profit and loss, cash flow and balance sheet. These docu ments provide you with an overview that will help you catch difficulties that are starting to develop. If you monitor your cash flow carefully you will see problems before they arise and, hopefully, have plans in place to avoid any disasters.
» 67JUNE - JULY 2022 es go up. The supply chain tie-up that started during the pandemic is a complex puzzle that usually is not thoroughly explained easily. Three giant ocean shipping alli ances that own the world’s big gest ships have been taking up so much space and time at ports it is creating a chain reaction. Mixed in with this chain reaction in cludes labor shortages, high stor age fees, and pandemic fears that have created a surge in consumer demand. All of these factors con tribute to the supply chain crisis. It is not clear what the solution will be for returning to normal.
9 Securing Adequate FundingThe pandemic has led to shut downs that have resulted in se vere financial losses for small businesses. But the good news for some is that resilient firms often bounce back stronger after being tested by significant chal lenges. One of the ongoing small business trends that began before the pandemic has been tightening budgets. Trying to do more with fewer people and less spending can be achieved through automa tion/digitization. For many small companies, a solution to busi ness survival has been reducing salaries while creating more flex ible work schedules – not an easy task but it is amazing what can be achieved when you sit down and have a chat with your staff. Strategies to consider are many and much varies depending on your size and sector but generally speaking you need to create a ‘business sur vivalYourmindset.’business survival plan should not just be a matter of developing and implementing specific strategies. The very nature of business requires you to be mindful of survival issues from the outset and on a daily basis. Your financial and emotional survival depends on this ongoing evaluation.
To develop a mindset that will set your business up for survival, treat every business decision you make as relevant and important. Business sur vival should not just be reactive, or a response to difficult circumstances, but pro-active, setting you up for fewer crises and a less frequent need to scramble and panic.
The Fishmonger knows from own experiences that running a busi ness is always fraught with difficulty and struggling to survive. If you plan carefully and conscientiously moni tor what is going on in the distinct parts of your operation, you will most likely have periods of healthy growth and times when everything runs smoothly. But do not become complacent even if you have no cur rent major headaches. Instead, think ahead and stay on top of internal and external threats that could shake up your hard-earned stability.
9 Labor Shortages and Attracting Talent – Through the pandemic people have made changes and we have seen the “great resig nation” from 2020-2021. Many Americans quit during the pan demic to re-think their family life and career choices. But even before the pandemic struck, spe cific industries, especially those with low level entry requirements such as ours, were experiencing labor shortages. The labor crisis goes deeper than people getting sick of their jobs due to pressures created by the pandemic. Inter net learning opportunities have opened doors for many people. Invest in your people through training and engaging with them.
Cutting costs: It is not enough to just increase your revenue if you do so by implementing changes that cost as much as they earn. Take a serious look at every aspect of your business and evaluate whether there might be ways to tighten things up and improve your bottom line. Can you make your production more efficient or find less expensive sources for key materials? The more thought and energy you put into answering these questions, the more opportunities you will find. The opportunity to put ‘sustainabili ty’ front and center as a central theme for all businesses is there to cut ex penses and waste to maximize pro ductivity and profitability.
The Fishmonger is a believer in a four prong attack solution (Diversifi cation, Increasing Revenue, Cutting Costs, and Improving Cash Flow) that every seafood business should look at in 2022. At every decision point you need to consider price ver sus quality. Do not throw the baby out with the bathwater as quality is an important consideration.
References and sources consulted by the author on the elaboration of this article are available under previous request to our editorial staff. nesses do not do this and with the right technology (could easily be a phone app) it is relatively easy.
Increasing Revenue: There are an un limited number of ways your busi ness can bring in additional income, provided you are resourceful and cre ative. From introducing new prod ucts to generation new markets, nev er grow complacent and always keep innovating. Even if you are satisfied with what you are currently earning, you should always be thinking ahead and anticipating new hurdles that will inevitably come your way. Discuss with your family and staff and get their input or take a few hours and see what your competition is doing –so much can be discovered by learn ing from others!
Despite your best efforts to man age your business in ways that will help it survive and thrive, there will be times when threats and problems require immediate attention. These difficulties may come about because of something you have done while running your company such as hiring an ineffective manager or introduc ing an ill-fated product. Alternative ly, they may come about because of something beyond your control such as an economic downturn or a wellfundedOverallcompetitor.tosurvive you need to develop and stick to mindful and healthy habits and teach your staff to do the same. This practice will not help you to always avoid crises, but it will make it much easier to manage problems when they arise. Good luck!
Diversification: Like any good business models, the importance of investing in multiple types of activities is essen tial. For example, if you have a fresh fish retail shop you should investigate engaging in other activities such as home delivery or cooking fish so that if the financial climate is unkind in any one of these areas, you will have other revenue resources to cushion the blow. If your business offers a range of products to a broad range of customers, you will insulate your self from the fallout if one of these areas hits a rough time.
»68 JUNE - JULY 2022 THE FISHMONGER
Improving cash flow: No matter how brilliant your ideas, you will not be able to implement them unless you have enough cash on hand to keep your company operating. Innovating can be expensive, as you inevitably have employees and suppliers and rent to pay. Work with your custom ers and provide incentives for them to pay you promptly. Secure low cost lines of credit if you can, and always keep some cash on hand for emer gencies. Build a loyalty program with your clients thus incentivizing their purchasing and their reliance on you.
» 69JUNE - JULY 2022 Upcomingaquaculture events AERATION EQUIPMENT, PUMPS, FILTERS AND MEASURING INSTRUMENTS, ETC DELTA HYDRONICS LLC...............................................................11 T: 727 861 www.deltahydro.com2421 FRESH FLO....................................................................................5 3037 Weeden Creek Rd. Sheboygan, WI 53081, USA Contact: Barb Ziegelbauer T: 800 493 3040 E-mail: www.freshflo.combarb@freshflo.com ANTIBIOTICS, PROBIOTICS AND FEED ADDITIVES BAJA AGRO INTERNATIONAL......................................BACK COVER Privada Kino Este No. 100A-1 Parque Industrial Misión Ensenada, Baja California, Mexico CP 22830 www.yucca.com.mx EVENTS AND EXHIBITIONS AQUACULTURE AMERICA 2023...................................................65 February, 23-26, 2023. New Orleans Marriott. New Orleans, Louisiana. Tel: +1 760 751 5005 E-mail: www.was.orgworldaqua@aol.com AQUACULTURE EUROPE 2022.....................................................21 September, 27 - 30, 2022. Rimini, Italy. www.aquaeas.org AQUA EXPO 2022 GUAYAQUIL.......................................................1 October, 17 - 20, 2022. Convention Center. Guayaquil, Ecuador. Tel: (+593) 4268 3017 ext- 202 E-mail: www.cna-ecuador.comaquaexpoec@cna-ecuador.com CONACUA 2022...........................................................................43 Novermber 30 - December 1st, 2022. Figlos Convention Lounge, Los Mochis, Sinaloa, México. Tel: 6681 030 484 / 6688156227 / 555 5634600 www.conacua.com LACQUA 2023...........................................................INSIDE COVER April, 18 - 21, 2023. Hotel Riu Plaza,Panama City, Panama. Tel: +1 760 751 5005 E-mail: www.was.orgworldaqua@aol.com WORLD AQUACULTURE SINGAPORE 2022..................................33 November 29- December 2, 2022. Singapore EXPO Convention & Exhibition Centre MAX Atria. Tel: +1 760 751 5005 E-mail: www.was.orgworldaqua@aol.com advertisersIndex AQUACULTURE MAGAZINE..........................INSIDE BACK COVER Design Publications International Inc. 401 E Sonterra Blvd. Sté. 375 San Antonio, TX. 78258, USA Office: +210 504 3642 Office in Mexico: +52(33) 8000 0578 - Ext: 8578 Subscriptions: iwantasubscription@dpinternationalinc.com Sales & Marketing Coordinator. Juan Carlos Elizalde crm@dpinternationalinc.com | Cell: +521 33 1466 0392 Sales Support Expert, Abril sse@dpinternationalinc.comFernández|Cell:+521 333 968 8515 PANORAMA ACUÍCOLA MAGAZINE Empresarios No. #135 Int. Piso 7 Oficina 723 Col. Puerta de Hierro, C.P.45116 Zapopan, Jal. México Office: +52 (33) 8000 0578 Contact 1: Subscriptions E-mail: suscripciones@panoramaacuicola.com Office: +52 (33) 8000 0629 y (33) 8000 0653 Contact 2: Juan Carlos Elizalde, Sales & Marketing Coordinator. crm@dpinternationalinc.com | Cell: +521 33 1466 0392 Contact 3: Abril Fernández, Sales Support Expert E-mail: www.panoramaacuicola.comsse@dpinternationalinc.com AQUACULTUREAUGUST CANADA AND WAS NORTH AMERICA 2022 Aug. 15 – 18 St. John´s, Newfoundland, Canada T: (+1) 760 751 5005 E: worldaqua@was.org and jmburry@nl.rogers.com W: https://www.was.org/Meeting/Registration/SelectCurrency AQUACULTURE PHILIPPINES 2022 Aug 23-25 Manila, Philippines T: +63 927 200 0724 E: W:apple.limbo@informa.comwww.livestockphilippines.com 1er Congreso de Acuicultura CONADOA 2022 Aug 24 – 26 La Altagracia, República Domnicana T: (+809) 5655603 ext 231 E: conadoard@gmail.com y adoa2020@cedaf.org.do W: cedaf.org.do/eventos/adoa_2021/ AQUACULTURESEPTEMBER INNOVATION FORUM Sept. 6 London, UK T: +44 (0)20 3696 2920 E: W:events@kisacoresearch.comaquacultureinnovationforum.com AQUACULTURE EUROPE 2022 Sept. 27-30, 2022 Rimini, Italy T: fax (+1) 760 751 5003 E: : worldaqua@was.org W: www.aquaeas.org AQUAOCTOBEREXPO GUAYAQUIL 2022 Oct. 16-20, 2022 Guayaquil, Ecuador T: (+593) 4 268 3017 ext. 202 E: W:aquaexpoec@cna-ecuador.comhttps://aquaexpo.com.ec WORLDNOVEMBERFAIR OF SHRIMP AQUACULTURE AND NATIONALS (FENACAM) Nov. 15 -18, 2022 Natal, Brasil T: +55 84 3231.6291 E: W:fenacam@fenacam.com.brwww.fenacam.com.br/ WORLD AQUACULTURE SINGAPORE 2022 Nov. 29-Dec. 2, 2022 Singapore, xxx T: +1.760.751.5005 FAX +1.760.751.5003 E: W:worldaqua@was.orgwww.was.org CONGRESO DE ACUACULTURA DE CAMARÓN CONACUA 2022 Nov. 30 y Dic. 1, 2022 Los Mochis, Sinaloa, México. T: 668 103 0484 – 668 815 6227 – 555 563 4600 E: W:organizacionconacua@gmail.comwww.conacua.com FEBRUARY AQUACULTURE2023AMERICA 2023 Feb.23-26, 2023 New Orleans, USA T: +1.760.751.5005 FAX +1.760.751.5003 E: W:worldaqua@was.orgwww.was.org APRIL 2023 LATIN AMERICAN & CARIBBEAN AQUACULTURE 2023 (LAQUA 2023) April 18-21, 2023 Panama City, Panama T: +1.760.751.5005 FAX +1.760.751.5003 E: worldaqua@was.org y carolina@was.org W: www.was.org