EDITOR´S COMMENTS
ARTICLE
New Green Pin® Aquaculture range: superior protection.


EDITOR´S COMMENTS
ARTICLE
New Green Pin® Aquaculture range: superior protection.
ARTICLE
Optimal levels of fish meal and methionine in diets for juvenile Litopenaeus vannamei to support maximum growth performance with economic efficiency.
ARTICLE
Global adoption of aquaculture to supply seafood.
ARTICLE
Engineering plant-based feedstocks for sustainable aquaculture.
Editor and Publisher Salvador Meza info@dpinternationalinc.com
Contributing Editor Marco Linné Unzueta
Editorial Coordinator Karelys Osta edicion@dpinternationalinc.com
Editorial Design Perla Neri design@design-publications.com
Sales & Marketing Coordinator Juan Carlos Elizalde crm@dpinternationalinc.com
Operations Coordination Johana Freire opm@dpinternationalinc.com
Business Operations Manager Adriana Zayas administracion@design-publications.com
Subscriptions: iwantasubscription@dpinternationalinc.com
Design Publications International Inc. 401 E Sonterra Blvd. Sté. 375 San Antonio, TX. 78258 info@dpintertnatinonalinc.com
Office: +210 5043642
Office in Mexico: (+52) (33) 8000 0578 - Ext: 8578
Aquaculture Magazine (ISSN 0199-1388) is published bimontly, by Design Publications International Inc. All rights reserved. www.aquaculturemag.com
Follow us:
UPCOMING EVENTS
ADVERTISERS INDEX

A/B Testing to improve your online marketing.
 By: Sarah Cornelisse*
What is the OIE and are they fulfilling their mandate to help aquaculture become sustainable?

 By Stephen G. Newman Ph.D. * President and CEO AquaInTech Inc.
Anew cycle is beginning, Aquaculture 2023, an opportune moment to define and implement various productive programs, where we must consider, as an important and high priority, the environmental performance and its impact, which, by monitoring and managing the environmental impact of aquaculture, can identify high priority areas of opportunity for sustainable development; however, the use of cost-effective tools is necessary to demonstrate compliance with discharge permits. Research is needed to assess the interactions between aquaculture and the environment; in particular, conventional approaches are needed to assess the environmental carrying capacity of local growing areas during preliminary site assessment.
Although research on aquaculture production is being developed to meet the requirements of sustainable biotechnology packages, research is needed to assess the environmental impact of agricultural practices, for example on aquaculture farming systems. Specific environmental impacts and sources of risk that require research include benthic impacts and
site remediation, disease transfer between wild and cultured populations, and the impact of escape of cultured organisms into the wild and their interaction with wild populations.
Terrestrial systems present different types of environmental impacts that may need to be monitored and managed, such as energy use and waste disposal. Standardized sustainability indicators should be used to evaluate environmental performance. Specific objectives for aquaculture environmental management research programs should be considered:
9 Characterize the impact of aquaculture methods on the environment. Reference sites will be used.
9 Develop and evaluate mechanized harvesting methods to improve management efficiency, reduce labor costs and minimize environmental impact.
9 Develop standard geographic and relational databases integrating environmental monitoring with shellfish production data to track broodstock and larvae throughout the production chain.
9 Develop cost-effective methods to assess aquaculture sites and environmental performance that can predict the potential for negative impacts (e.g., benthic transfer, disease, or escape of organisms) and positive impacts (e.g., habitat creation, increased biodiversity).
9 Evaluate the adequacy of readily measurable indicators of aquaculture’s impact on the environment.
9 Develop and validate models of environmental performance and carrying capacity.
In addition to establishing the environmental conditions of the region, Systems Engineering and Support Systems should be considered, since some aquaculture systems will be of intensive conditions, and therefore increasingly depend on technological development considerations for life support engineering and waste treatment services, mechanization of management operations and risk reduction.

On the other hand, design specifications for waste treatment and life support systems will need to be clarified according to species and stage of development. Basic research on microbial processes and their relationship to water quality and target crop yields is also being addressed by researchers on a global scale. Establishing metrics to assess changes in biological resource use efficiency and ecological footprint can guide management improvements that impact production competitiveness.
In general, engineering needs are specific to the culture system, species, site and facilities that promote sustainable development of the aquaculture activity.

The organization of Seagriculture Asia-Pacific 2023, which will be held online on February 8 and 9 next year, has unveiled the program of its first edition in the eastern continent. According to the announcement, more than 20 speakers will speak during six sessions, including a round table on the status of algae in Asia-Pacific and a virtual tour of algae around the world.
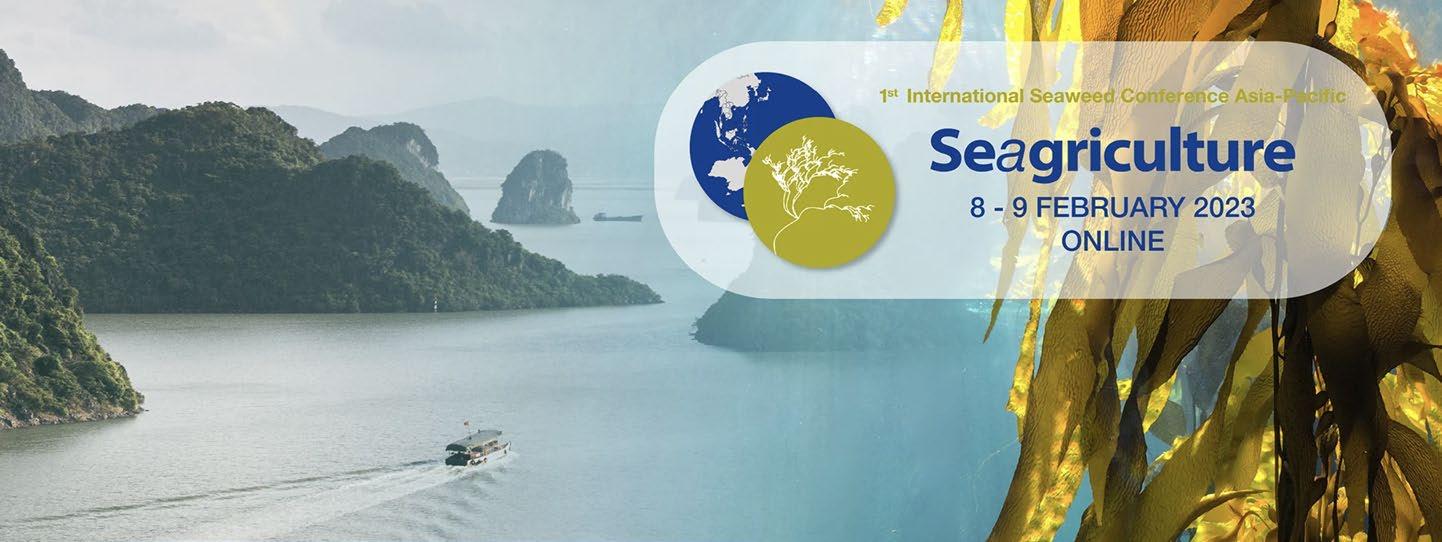
The most prominent names are Simon Funge-Smith, Senior Fisheries Officer, FAO Regional Office for Asia and the Pacific, Thailand; and Brian Von Herzen, Executive Director, Climate Foundation, Australia.
The speakers’ lectures will be distributed over six sessions, in addition to that of guest speaker Scott Lindell, research specialist at the Woods Hole Oceanographic Institution in the United States (USA)
and winner of the Seagriculture USA 2022 Gold Award for Innovation.
Six interesting working sessions
Seagriculture Asia-Pacific 2023 will gather top speakers, who will share their know-how within seaweed for feed, food, offshore cultivation, biorefinery of seaweed, and much more. The first of the sessions will be dedicated to “Smart Seaweed Farming”, featuring Shrikumar Suryanarayan, CEO of Sea6 Energy, India; Job Schipper, consultant and director of SEAWISER, the Netherlands; and Tran Dinh Luan, CEO of D-Fish, a company from Vietnam.
The second session will discuss “The business and investment aspects of seaweed”. It will feature Paul Dobbins, Senior Director of
Impact Investments at the World Wildlife Foundation in the USA; Koji Yamamoto, Director General of the Aquaculture Stewardship Council (ASC), based in Japan; and Karlotta Rieve, Director of Regenerative Aquaculture Projects at Hatch Blue, from Mexico.
Meanwhile, Session 3 will be the “Roundtable: Status of Seaweed in Asia-Pacific”, featuring Maya Puspita, seaweed specialist and marine biologist, Director of SELT Alga Indonesia, and R&D Director of the Indonesian Seaweed Association (ARLI); Jo Kelly, CEO of the Australian Seaweed Institute, Australia; and CRK Reddy, CEO of the Indian Centre for Climate and Social Impact Research.
The second half of the program begins with Session 4, dedicated to
“Seaweed farming and disease aspects”. Present will be Michael Y. Roleda, Professor, University of the Philippines; and Nita Rukminasari, Associate Professor, Universitas Hasanuddin, Indonesia.
Session 5 will be on “Applications of marine algae”, with the participation of Rob Kinley, Chief Scientist of FutureFeed, based in Australia; Jang K. Kim, Professor at Incheon National University, South Korea; and Pia Winberg, Managing Director of PhycoHealth, Venus Shell Systems, Australia.
Finally, Session six will be on “Virtual Journey through the World of Seaweed”. It will feature Mitchell
Lench, CEO of Ocean’s Balance in the United States; Stephanie Debels of Belgium’s SEACROPS; Alejandro Buschmann, Scientist at the Universidad de los Lagos in Chile; Josh Castle of Aboitiz Reimagine in the Philippines; and Jorunn Skjermo, Senior Research Scientist at SINTEF in Norway.
Registration for the first edition of Seagriculture Asia-Pacific includes live streaming and access to all recordings after the end of the event. Interested parties can obtain more information at seagriculture-asiapacific. com. “Don’t miss this unique op-
portunity to network with colleagues from all over Europe, North America, Asia-Pacific and beyond within the Seaweed industry,” said the organization.
It is important to note that the Seagriculture event has been held since 2012 on the European continent, where it has built a solid reputation as the leading conference for the seaweed industry sector. As explained from its organization, led by DLG Benelux, it is expected that holding a Seagriculture Conference in each of the major seaweed regions of the world will create synergies between the events and further contribute to the development of the sector.
The global tilapia industry currently enjoys a value of USD 14.1 billion and is estimated to reach a size of USD 22.3 billion by the end of 2033, according to the report created and released by Fact. MR. Global demand for tilapia fish is expected to increase at 4.6% CAGR over the next ten years, they assured. The detailed research report on the global tilapia market focuses on the macro as well as microeconomic factors that are helping its development.
The report also concentrates on the regulatory framework that is shaping the future of the global market. Furthermore, the research report also makes not of the existing as well as prevailing pricing structure, emerging areas of applications, and imminent investment opportunities in the global market.
The tilapia study outlines the key regions – North America, Latin America, Europe and APAC – along with the countries contributing the most in the respective regions. Prominent players covered in this research are Netuno Internacional, Baiyang Aquatic Group, Regal Springs Tilapia, North Atlantic Fish, Fact. MR explained.
Also, the report presents detailed insights about each market player, including SWOT analysis, main market information, market share, revenue, pricing and gross margin.
In addition to the prediction of USD 22.3 billion by the end of 2033, some of the key takeaways from Fact.MR’s Tilapia Market Study are that market for tilapia is anticipated to progress rapidly at a CAGR of 4.6% from 2023 to 2033 (forecast period); increasing health consciousness and growing demand for fish protein are prime factors propelling market growth; in addition, the Nile tilapia segment is expected to increase at a CAGR of 4% during the forecast period 2023-2033.
Also, the study assures that global tilapia software market is worth USD 14.1 billion in 2023.
The market for tilapia is segmented into Nile tilapia, blue tilapia, Mozambique tilapia, and Wami tilapia. According to the report, the first of it will be the principal.
“At present, Nile tilapia is the most widely consumed species of tilapia across the world. This species is primarily found in the Latin American, African, and Middle Eastern parts of the world. Nile tilapia is preferred by a large number of people owing to its high advantages for farming from technique as well as ecological standpoints.”
In ponds, Nile tilapia is capable of feeding on phyto-plankton and requires very less maintenance, which makes it a perfect low-cost aquaculture alternative for farmers around the world. Demand for Nile tilapia fish is anticipated to evolve at 4% CAGR over the next ten years.
The report states key tilapia suppliers are focusing on expanding their business potential by acquiring new capital and launching new initiatives to meet the increasing demand for tilapia fish.
For example, in October 2022, Brazilian tilapia fish producer Tilabras announced that it had secured USD 9.7 million from Ocean 14 Capital, a Lon-
don-based private equity impact investment fund. The investment was made on the grounds of sustainability and environment conservation as Ocean 14 looks to expand its portfolio in the same direction and Tilabras practices sustainable aquaculture.
In the case of FAI Farms, a multi-disciplinary team of farmers and scientists working on improving food security and maintaining sustainability, announced in December 2022, the launch of its new free-to-use tilapia welfare application. The application was developed by FAI while working with farmers and scientists from China, Brazil, and Thailand. The app uses scientifically validated welfare indicators for nutrition, behavior, and fish health.
In the latest report by Fact.MR, they show an unbiased analysis of the global tilapia market, providing historical data for the period of 2016-2020, and forecast statistics for the period of 2023-2033.
In order to understand the global market potential, its growth, and scope, the market is segmented on the basis of form (dried tilapia fillets, fresh or chilled tilapia fillets, frozen tilapia fillets, and frozen whole tilapia), species (Nile tilapia, blue tilapia, Mozambique tilapia, and Wami tilapia), and catch (wild catch and aquaculture), across seven major regions of the world (North America, Latin America, Europe, East Asia, South Asia, Oceania, and MEA).
New technology resulting from a pioneering research and development project led by Irish company Impact-9 could lead to huge growth in seafood production at exposed offshore sites. According to the company, the offshore wind turbines could also be used as salmon farms and generate more than GBP 4.2 billion (about USD 5.2 billion) in turnover for Scotland’s aquaculture sector, quadrupling its current production.
Impact-9’s Net9 System is a submersible, floating structure that utilizes the ecosystem and natural conditions of the ocean, and is one step closer to becoming a commercial reality, with a proven design concept now ready to be tested at scale. As reported from Impact-9, once built on a large scale, a single Net9 pen could produce up to 2,500 tons of salmon per year, with oxygen-rich waters and conditions that mimic nature helping the fish to thrive. Start-up company Impact-9 identified an opportunity to use the new technology within existing and planned offshore wind energy zones, where a small portion of the zonesaround 12 x 12 km - would be enough to accommodate 280 pens and quadruple Scottish production.
This breakthrough marks the end of the last phase of the GBP 200,000 Inflatable Marine Inflatable Containment Technology for Aquaculture (IMPACT) project, which was funded by the UK Seafood Innovation Fund (SIF) with additional support from the Sustainable Aquaculture Innovation Centre (SAIC).
Importantly, the SIF supports new ideas to deliver cutting-edge technology and innovation to the UK’s fisheries, aquaculture and fishing industries. Administered by the Centre for Environment, Fisheries and Aquaculture Science (CEFAS) on behalf of the Department for Environment, Food and Rural Affairs (Defra), the program encourages sustainable and innovative ideas to achieve sea-
food safety, new partnerships between the seafood and technology sectors, and to contribute to sound evidence-based management. Engineers from Tension Technology International (TTI), and blue economy project developer Simply Blue Group, also participated in the development, looking at regulatory issues, fish health and welfare, as well as the cost challenges associated with bringing aquaculture to open ocean environments.
The position of wind turbines is generally determined by water depths, currents and the need to avoid shipping lanes, which are also factors that would influence the suitability of a location for offshore aquaculture.
“A move further offshore could pave the way for a new sustainable aquaculture industry of scale, worth billions of pounds in the UK alone. The economic potential is similar to offshore wind; however, it will occupy a relatively small amount of ocean area and could fit in with existing and planned offshore wind turbine arrays,” said John Fitzgerald, CEO of Impact-9. “In the same way that lithium-ion batteries are the key to green transportation, we believe that smart flexible structural elements such as those used in Net9 will be the enabler for offshore seafood production,” explained the company’s representative.
Impact-9’s system uses a flexible structure that is designed to move with the waves and weather any storm, rather than fight the water, reducing potential stress on the fish. “The most exciting part of this phase of work was seeing the positive crossover between fish welfare and structural engineering. The potential for storm surge is, of course, inevitable in these environments, but the design of the system allows the net and
the fish contained within it to move together with much more flexibility than a rigid structure,” Fitzgerald detailed.
Next year, the research team plans to start building a unit suitable for technical demonstration at the European Marine Energy Center (EMEC) in Orkney, which will also give interested producers the opportunity to see a model of the system in operation. For his part, Tom Mackay, TTI’s engineering manager, said, “This is part of a systematic engineering approach to address technical novelty and undergo carefully managed testing to qualify that the new features will work as intended. The process is similar to the development of offshore renewable systems, and we have brought experience from that sector to help Impact-9 manage the risk of adopting their new structures in the Net9 application.”
New technology developed by Irish company Impact-9 could generate over GBP 4.2 billion in turnover for Scotland’s aquaculture sector
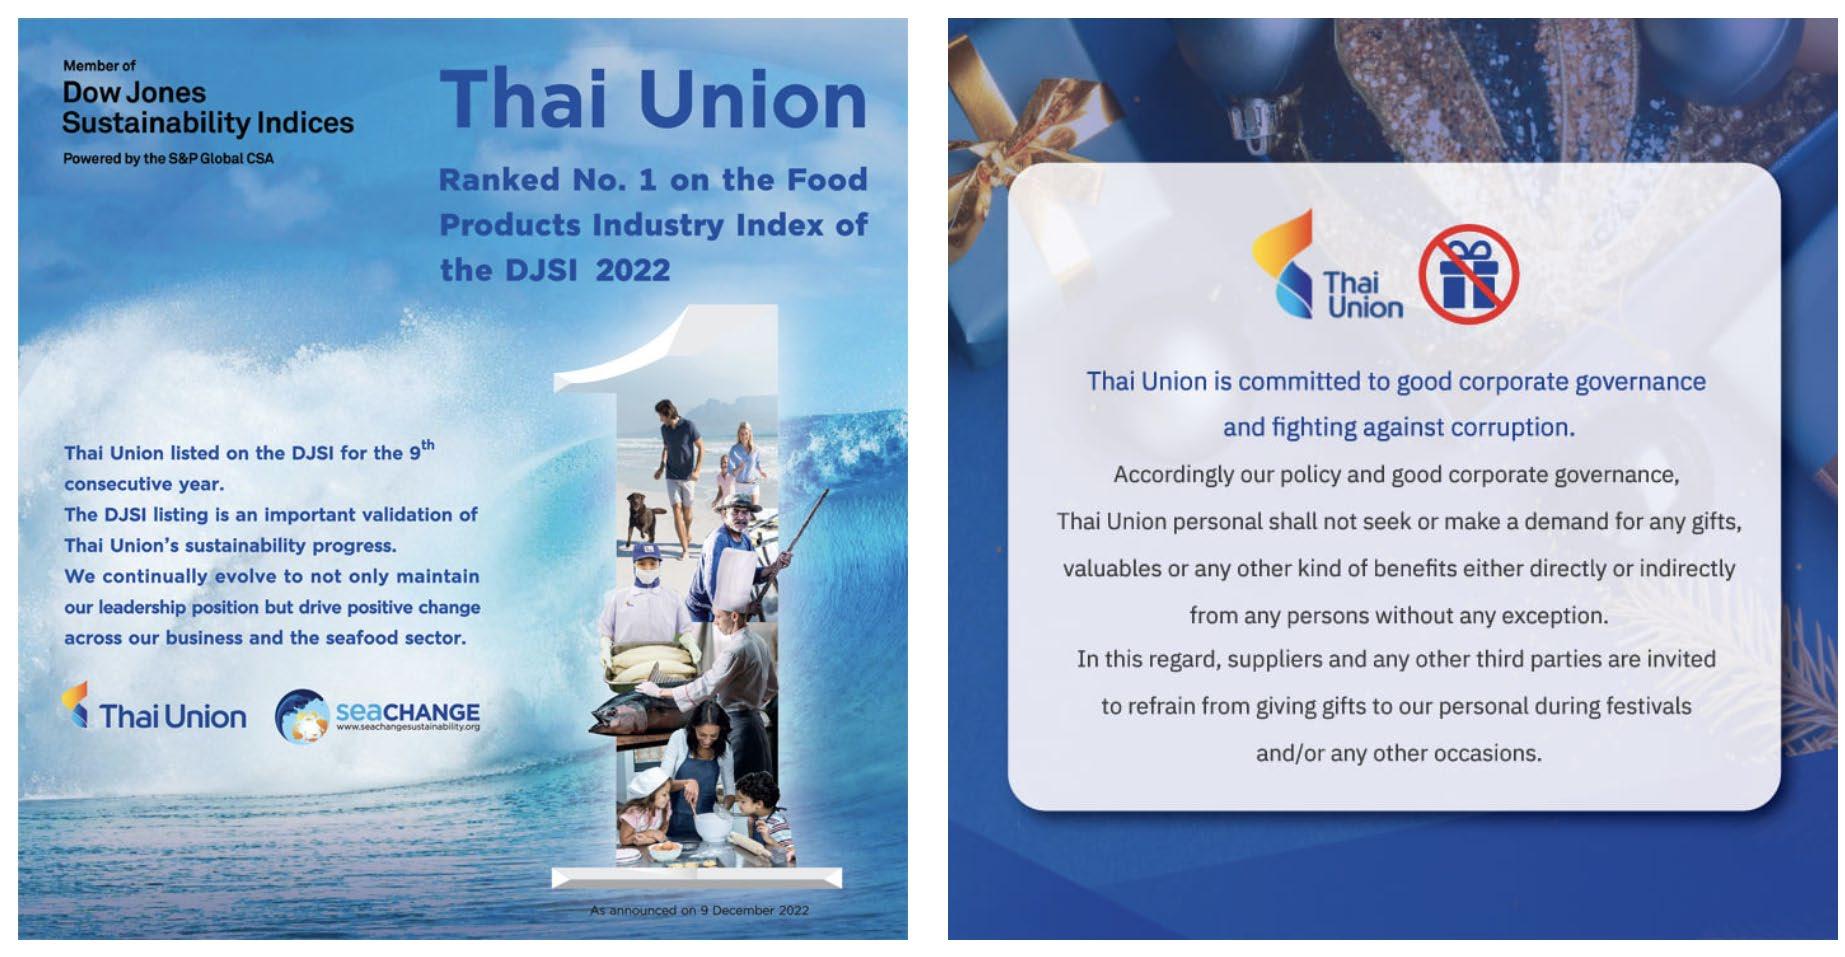
Some weeks ago, Thai Union Group has been ranked number one in the world in the food industry on the Dow Jones Sustainability Indices (DJSI), further validating the progress made under its global sustainability strategy, SeaChange®. The group, one of the world’s largest seafood companies, has now been listed for nine consecutive years on the DJSI, a family of indices evaluating the sustainability performance of thousands of publicly traded companies. The company was ranked number one on the Food Products Industry Index of the DJSI.
“Sustainability sits at the heart of Thai Union’s business,” said Thirapong Chansiri, President and CEO of Thai Union. “We are ambitious about driving positive change not just in our own operations but across the entire global seafood industry. Through our commitment to ‘Healthy Living, Healthy Oceans,’ our company is implementing industry-leading initiatives that are not just addressing some of the biggest challenges facing the industry but delivering impactful change.”

The top ranking on the DJSI comes after Thai Union was last year ranked number one on the Seafood Stewardship Index (SSI) for the second consecutive time for its performance delivering towards the United Nations Sustainable Development Goals (UN SDGs).
In the dimensions of Social and Environmental, Thai Union achieved
a 100th percentile score while it received a 97th percentile score for the Governance & Economic Dimension. The company also received a 100th percentile score in 18 areas: Materiality, Risk & Crisis Management, Policy Influence, Supply Chain Management, Innovation Management, Environmental Reporting, Environmental Policy & Management Systems, Operational Eco-Efficiency, Biodiversity, Sustainable Agricultural Practices, Water Related Risks, Social Reporting, Human Rights, Living Wage, Talent Attraction & Retention, Corporate Citizenship & Philanthropy, Occupational Health & Safety, and Health & Nutrition.
During the last year, Thai Union has continued to advance its sustainability strategy, including installing an additional 7 Mega Watts of solar energy at the company’s factory in Samut Sakhon; in the Seychelles, 30% of Thai Union’s fish processing plant is covered by solar panels, supplying 8% of its total energy consumption; and entering a partnership with the Sustainable Fisheries Partnership to strengthen transparency in Thai Union’s supply chains.
Also, the company adopted the “Employer Pays Principle”, meaning that no migrant worker pays for a job; conducting the company’s first at-sea audits, the first of its kind
Validating the progress made
its global sustainability strategy, Thai Union is ranked number one in the world in the food industry
conducted in the industry; as well, demonstrating leadership in Blue Finance with Sustainability-Linked Loans and Sustainability-Linked Bonds, which include targets that deliver benefits to the oceans.
“At Thai Union, we’re proud to be a leader and set the standard for others in the seafood industry to follow,” said Adam Brennan, Group Director, Sustainability, at Thai Union. “We are committed to continuing to demonstrate that leadership and we’re excited that in early 2023 we will announce the next iteration of SeaChange ®, with a series of ambitious targets through to 2030 including climate change goals in line with the Science Based Targets Initiative.”
The S&P Global Corporate Sustainability Assessment (CSA) evaluates and assesses the sustainability practices of approximately 10,000 companies globally every
year. The CSA enables companies such as Thai Union to benchmark their performance on a wide range of industry-specific economic, environmental and social criteria that are relevant to sustainability focused investors.
Thai Union Group PCL is, with no doubt, a world’s seafood leader for 45 years. Today, the company is regarded as one of the world’s leading seafood producers and is one of the largest producers of shelf-stable tuna products with annual sales exceeding THB 141.0 billion (USD 4.5 billion) and a global workforce of more than 44,000 people who are dedicated to pioneering sustainable, innovative seafood products.
The company’s global brand portfolio includes market-leading international brands such as Chicken of the Sea, John West, Petit Navire, Parmentier, Mareblu, King Oscar, Hawesta, and Rügen Fisch, Thai-leading brands
SEALECT, Fisho, Qfresh, Monori, OMG Meat, Bellotta and Marvo , and ingredient and supplement brands UniQ®BONE , UniQ®DHA and ZEAvita.
As a company committed to “Healthy Living, Healthy Oceans”, Thai Union manifest is proud to be a member of the United Nations Global Compact, a founding participating company of the International Seafood Sustainability Foundation (ISSF), and current Chair of Seafood Business for Ocean Stewardship (SeaBOS).
Thai Union’s on-going work through its SeaChange® sustainability strategy was recognized when the company was listed on the Dow Jones Sustainability Indices (DJSI) for the ninth consecutive year in 2022. Thai Union was also named to the FTSE4Good Emerging Index for the sixth straight year in 2021. Find out more about our work at seachangesustainability.org.
Home grown shrimp is currently one of the hottest topics in the European Aquaculture sector, this article attempts to explain why this has come about, where the major development is occurring, what technologies are currently being employed and finally, what are the future prospects for this novel industry.
By: Philip Buike*Without doubt, the culture of warm water shrimp has become, over the last 30 years or so, one of the biggest money makers of all Aquaculture produced species, with some estimates for the world market as high as 50 billion USD by the end of this decade, its big money!
On the other hand, up until very recently, Europe has not really profited from this boom, as all this shrimp has traditionally been imported from countries located on or close to the Equatorial belt, Ecuador itself being a prime example. Last year alone (2021), Europeans spent more than two billion euros on just one species of shrimp, Peneaus vannamei or the Pacific White Shrimp. This currently makes Europe one of the World´s top shrimp consumers along with the USA and China. Clearly a market as big as this based almost entirely on imports, provided the main impetus for taking the first steps toward home produced shrimp in Europe, initially with P.
vannamei but over time P. japonicus, P. monodon and P. stylirostris where also introduced.
There have been attempts to produce warmwater shrimp outside the tropical belt since the early 70´s, the Coca cola Company being one of the first to invest serious money. Most of the pioneering work took place in the USA, particularly the Harbour Branch Marine Institute (HBMI) in Florida. Other countries such as Japan and Israel also made some important contributions during this initial phase of development.
However, over the years one critical issue remained unresolved; how do you compete with a 3 USD per kilo cost of production typical of many traditional shrimp producing nations?
Leading up to the present day, this gulf between production costs between developed and developing nations has not in any way diminished, however in the European market, other factors are coming
into play and the hope is that the combined impact of these factors is sufficient to elevate sales price sufficiently to offset the significantly higher costs associated with shrimp culture outside the tropical belt.
Factors currently favoring domestic productions of shrimp in Europe include:
9 Negative perceptions associated with imported shrimp such as questionable labor practices, environmental degradation, poor hygiene control at the point of processing and the presence of harmful substances in the shrimp tissue,
Note: At this point, I feel that it is very important to point out that the author does not share these views and whose personal experience supports the view that Ecuador at least, produces, processes and exports extremely high-quality shrimp, cultured in a manner that is both ecologically sustainable and respectful of local communities.
9 Preference for local produce. Carbon footprint is now in the public eye and a significant number of consumers will make purchasing decisions based primarily on this factor.
9 The possibility of obtaining high quality, fresh shrimp in markets previously starved of any kind of fresh seafood. Coincidently these markets are concentrated in the most affluent parts of the European continent which allows an extra degree of price elasticity.
Also, technical developments in shrimp farming over the last decade or so, are now having a real impact on the ground, these include:
9 Production systems that can rear shrimp at sufficient densities to be economically viable given European cost profiles, whilst conforming fully to EU environmental protection legislation.
9 Dramatic improvements in shrimp growth performance through genetic selection by specialized shrimp breeding centers. These are all currently based in Hawaii and US mainland, however both infrastructure and know how exists in Europe to set up breeding centers to provide shrimp broodstock specific to local needs, as and when demand justifies the investment.
9 Over the past two years, Europe has had its own supply of shrimp larvae from at least one commercial hatchery. This is of critical importance, as prior to this; the development of shrimp farming in Europe was entirely dependent on imports of larvae from the USA. Because of this, there have been at least two documented cases of larvae arriving in Europe infected with a notifiable virus which eventually led to the closure of the farms involved.
As a result of this increasingly favorable climate, small scale pilot ventures where set up in various locations across Europe, Belgium and Switzerland being probably the most notable. These early ventures were all based on a culture system known as Biofloc technology. This system was originally developed in Israel to produce both shrimp and fish at greater densities than those achieved by the conventional flow through systems of the time, and quickly gained popularity throughout the aquaculture world. In greatly simplified terms, the system relies on a specific microbial balance in the tank water to maintain suitable water quality conditions for growth, by using the bacteria themselves as a filter to “mop up” organic waste. As the system does not require complex mechanical filtration systems, it is relatively cheap to build and operate (but as we shall see later, cheap does not necessarily mean easy!).
I think that shrimp farming in Europe is here to stay.
Due to the early success of some of these operations, interest has grown and funds have become available for the growth and development of new operations, which brings up to the present situation in Europe. Currently we appear to be in the middle of a second wave of investment fueled by the fact that proof of concept has now been provided on European soil, demand for imported shrimp shows no signs of slowing down and as suggested previously, new entrants into the business can now get larvae locally which greatly simplifies the process. At the same time, environmental awareness in general has become a key issue and the implications of producing millions of kilos of shrimp in environmentally sensitive areas and then shipping them thousands of kilometers to their final market, has not gone unnoticed, providing a strong motive to provide a locally produced alternative.
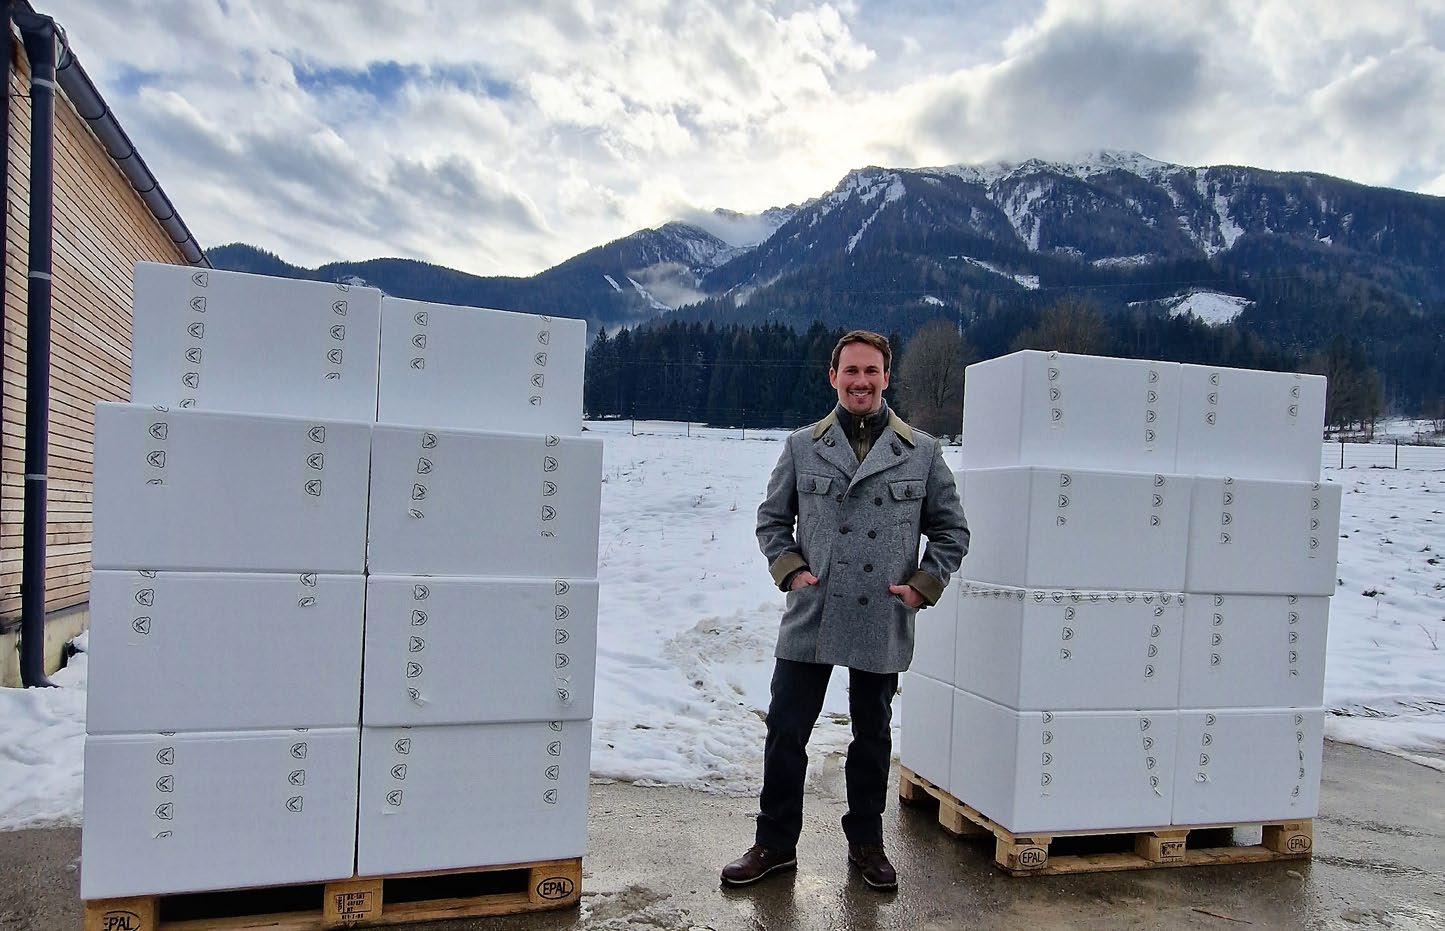
Today, we can see successful operations in Spain, Switzerland, Austria and Germany (amongst others) that have demonstrated that the entire shrimp lifecycle from eggs to adult reproductive stock can be sustained artificially, many kilometers from the nearest natural source of seawater.

In most cases this has been achieved through the application of RAS, a collective term used to describe a group of technologies dedicated to the artificial generation and maintenance of optimum environmental conditions for shrimp growth and development throughout their lifecycle. Recirculating Artificial Seawater systems (RAS) are now seen by many investors as the key to the future growth of shrimp farming in Europe.
As suggested above, most new ventures seem to be taking the RAS option (Ukrainia and Sweden being the latest examples) as opposed to the Biofloc systems favored by the earlier operations that did manage to demonstrate success. Relative to Biofloc, RAS systems are both far more complex and expensive to build and run, requiring not only highly skilled biologists but also engineers in a range of disciplines to ensure continued operation. There must therefore be a good reason for this preference for cost and complexity.
To answer this question, we need to look a bit closer at what has actually been the experience of
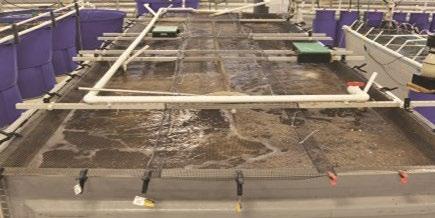
shrimp farming in Europe up to present. Initially shrimp farming in Europe was based on what was already known and what was known was that simple Biofloc technology could be adapted to produce shrimp in small scale operations, whose product could be sold successfully in local markets. Kentucky State University (USA) did much to simplify operations and provide support for a large number of “Ma and Pa” set ups that are now operating throughout the Midwest of the USA (Figure 3).
This model was what was first imported into Europe and we can still see a number of examples today. It has a number of advantages, low initial investment cost and relatively simple operational requirements being I feel the most important. However, Biofloc is still very much a “black box” affair, being that it is fundamentally based on complex, dynamic microbial population interactions. The precise mechanisms of these are still lacking and it appears that the system has a definite lifecycle in which after a prolonged period of operation, undesirable bacterial species begin to dominate to the detriment of shrimp health,
production levels gradually drop off to sub economic levels and often it is very difficult to reboot the system. Until much more is known about the long-term management of Biofloc systems, I feel that scaling up to true commercial levels will be challenging. A secondary problem associated with Biofloc is the production of highly saline sludge that cannot be simply and cheaply disposed of. Any large-scale operation will have factor in the cost of dewatering and desalinating sludge as part of the production cost profile, as there is no part of Europe that permits the direct disposal of organically rich, highly saline effluent. That said, the combination of Biofloc and the hydroponic production of salt resistant vegetables is being trailed in France and elsewhere, time will tell if this novel approach can be scaled up to a commercially viable activity.
Getting back to RAS systems, throughout Europe there is increasing pressure on the fish farming sector improve its effluent control and eliminate wild/captive fish interactions. Many fish traditionally grown in cages in the sea, from Atlantic salmon in Scotland and Nor-
way, to Gilthead seabream and seabass in the Mediterranean are now coming ashore to be cultured using RAS technology systems. In few a few short years, this will move from optional to obligatory, it will be the only way that fish farmers will be able to comply with EU environmental standards. In my view this is a good thing and should be embraced as a positive step toward the future.
It would be churlish to suggest that RAS has not been without its teething troubles and as I will mention in the following paragraphs, there are still some significant issues to be addressed before this can be considered fully developed for intensive shrimp culture. That said, there are many examples of welldesigned and operated RAS systems throughout the world that work and provide an end product whose value exceeds the total cost of inputs.
In summary therefore, RAS currently appears to be the technology of choice because:
9 If correctly designed, built and operated, it is time independent.
It will provide the same results in ten years as it did when recently started up. (Biofloc usua -
lly starts very well then suffers a performance drop-off after 2-3 years of continual operation.)
9 A correctly designed RAS should not produce any sludge.
9 Scaling of RAS systems is a linear operation based on mechanics, scaling of Biofloc (and flow through) is often dependent on non-linear biological interactions which are far more difficult to predict, much less control.
9 Computer based technology is developing rapidly to provide real time systems for the control of physical parameters.
9 A well-designed RAS system should have negligible environmental impact, allowing the location of RAS based farms virtually anywhere from city centers to the heart of the Alps.
However, the following areas still require work:
9 RAS operations have a very high energy demand.
9 Require highly skilled staff to operate, RAS experts are currently in short supply globally.
9 Certain modifications are required due to the specific environmental
requirements of shrimp, the first of which is to provide sufficient water flow for effective filtration whilst still allowing the shrimp to maintain their position without excessive energy expenditure. This is not a problem for fish, as increased swimming activity actually improves flesh quality.
9 Effective removal of dissolved organic material (DOM). DOM is a problem as it provides a readily available nutrient source for bacteria and if uncontrolled can lead to disease outbreaks. Again, this is more of a problem for shrimp as they have a simple, non-specific immune system that does not allow for vaccine therapy and leaves the shrimp highly vulnerable to some bacterial groups, particularly Vibrio spp.
This is literally, the million(s) dollar question, can shrimp farming in Europe ever be a large scale, profitable enterprise?
In the last five years Europe has moved on from, “can it be done?” to “can it be done profitably?” and by profitably, I mean, “can it obtain a rate of return that exceeds alternative investments with a comparable level of risk?”.
To attempt to answer this question I will first describe what I think is not going to happen:
9 Under the current EU trade situation, Europe will never be a major producer of shrimp. The world market is dominated by a single product, whole frozen 12 – 15 gram white shrimp sold to the consumer at around 10 euros per kilo via supermarket chains. This is commodity product traded on stock exchanges throughout the world; it has well established supply and does not suffer seasonality or supply fluctuations due to the vast and interchangeable number of suppliers available. In short, its cheap and its always available, everywhere. This is a product that European operations cannot provide whilst still hoping to make a profit.
9 Consolidation of the European industry is not going to happen overnight.
9 Unless live imports of larvae from the USA are no longer permitted, it will be increasingly difficult to maintain Europe´s disease free status with regard to many of pathogens that have decimated shrimp farming in other parts of the World.
With this in mind of think the most likely future scenario is as follows.
9 Over the next five years or so, production technology will have developed to a point where operating risk will be considered acceptable. Given that during the same period, RAS technology will also become far more common for the culture of fish in Europe, it is reasonable to assume that shrimp farming in Europe will continue to be at the forefront of RAS technology.
9 If price wars are to be avoided, then production should be con -
“Can it obtain a rate of return that exceeds alternative investments with a comparable level of risk?”
centrated on a limited luxury market by emphasizing quality, origin and ecological criteria over price. Because of this luxury status, production volumes will naturally be limited by demand at some point. It will be therefore, important not to fall into the overproduction trap that beset Turbot farming for example, where eventually excess supply depressed price below production costs.
9 Exportation of European shrimp will be limited unless live shipment to extremely exclusive markets in the Middle East and Asia can be justified by the premium prices obtained.
9 One area for exportation that might have potential is for broodstock and larvae assuming that Europe´s disease free status is protected.
There are however other interesting possibilities. Large parts of Southern Europe (Spain, Greece, Italy and Portugal) have both land availability and climatic conditions that could support seasonal warm water shrimp production. Using the model currently employed in Northern Mexico, local hatchery reared larvae could by stocked in cheap plastic covered “nursery ponds” in late spring, these juveniles would then be released at low densities into traditional ponds in summer and harvested before the end of September. This would be a low cost means of obtaining a high value product from land that was previously considered marginal.
Interestingly, currently a penaeid species tolerant to cooler water, P. japonicus is being cultured in open ponds in Southern France. Product quality is excellent and there is no problem with consumer acceptance at prices considerably higher than the supermarket alternative.
At present, this is more of a personal vision than anything else, but it would certainly offer a means of making shrimp culture a mainstream activity, at least in certain areas of Southern Europe.
So, in conclusion, I think that shrimp farming in Europe is here to stay, but whether finally it will be a hightech based business based close to the urban centers of Northern Europe, a relatively low-tech operation making use of marginal land in the warmer climes of Southern Europe or possibly a combination of both, I cannot say. I can say with confidence however, that although European shrimp farmers will never compete on the World market, it is possible that over time they will gain a reputation as being amongst some of the most inventive and dedicated operators in this vast and truly diverse branch of aquaculture.

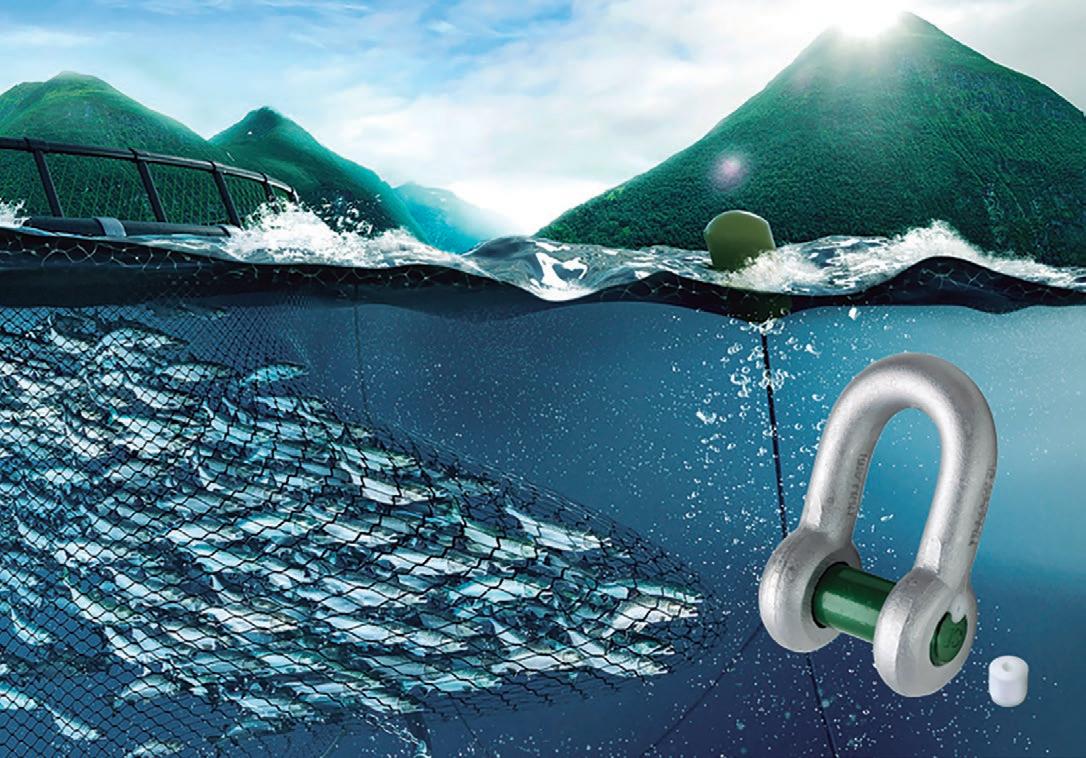
If ever durable products were required, it is probably most visible in the fishing and aquaculture industries. Your underwater cages and mooring systems need shackles, bolts and other mooring accessories that are below surface, but above standard. That is why the Green Pin® aquaculture products are the top choice for fish farmers.
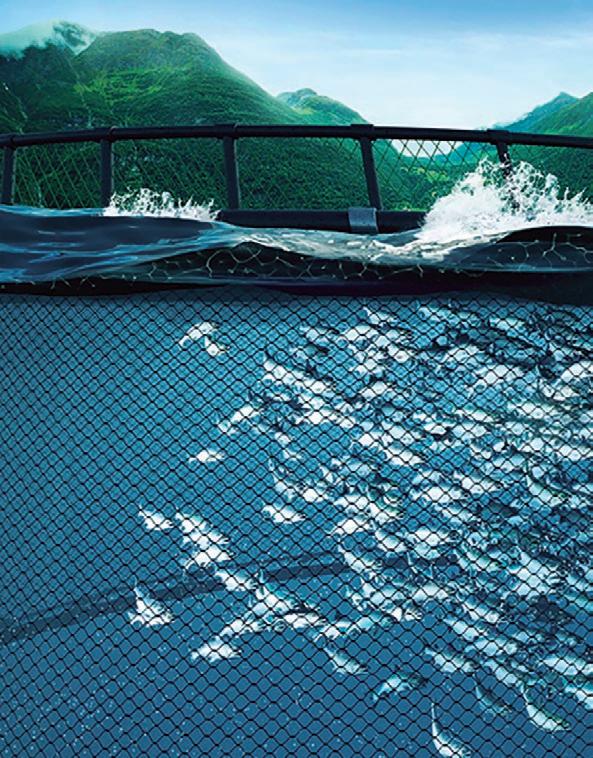
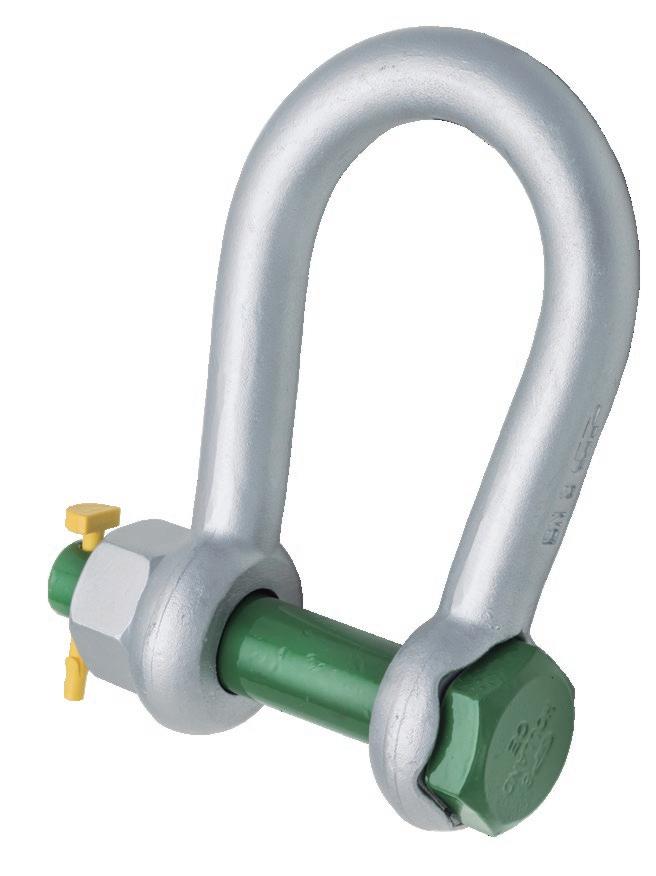
If ever durable products were required, it is probably most visible in the fishing and aquaculture industries. Equipment is constantly exposed to water, salt and different temperatures. For aquaculture, cages need to be secured under water reliably for longer periods of time to safeguard large investments. Your underwater cages and mooring systems therefore need shackles, bolts and other mooring accessories that are below surface, but above standard. That is why the Green Pin® aquaculture products are the top choice for fish farmers.
What’s more, the products within the new Green Pin® aquaculture range have been designed, extensively fatigue-tested and DNV type approved by the NS 9415 standard as required by NYTEK regulation. Galvanization of Green Pin® lifting accessories assures long-term durability, even under harsh, salty conditions. The products in our range to safeguard your investments are:
The Green Pin® Mooring Bow Shackle NS9415 BN is a bow shackle with a safety bolt and a sunken bolt head that has been designed for mooring applications. The shackle offers a double safety (safety bolt and synthetic cotter pin) which prevents accidental unscrewing of the pin. The sunken bolt prevents rotation of the bolt, making it much easier to assemble. It also minimizes the risk of damage to the cage net or mooring line. The wider shackle mouth enables you to connect the shackle to a mooring or connecting plate which is wider than usual.
Safeguard your aquaculture investment with the strongest and most durable aquaculture shackle on the market. The new Green Pin® screw pin shackle features a double safety (bolt and plug). With an industryleading safety factor of 7 x WLL and a fatigue-rating of over 40,000 cycles (twice the minimum requirement).
The Green Pin® Dee Shackle
NS9415 FP is an exemplary shackle in this product line. Its square, sunken hole screw pin combined with a safety plug makes it a double safety product that is easy to assemble and disassemble with the Green Pin® Sunken Hole Key.
The Green Pin® Bow Shackle
The Green Pin® Bow Shackle BN is a bow shackle with a safety bolt. The shackle offers a double safety (split pin and safety bolt) which prevents accidental unscrewing of the pin. The Green Pin® Bow Shackle NS9415 BN is suitable for both one-leg and multi-leg systems.

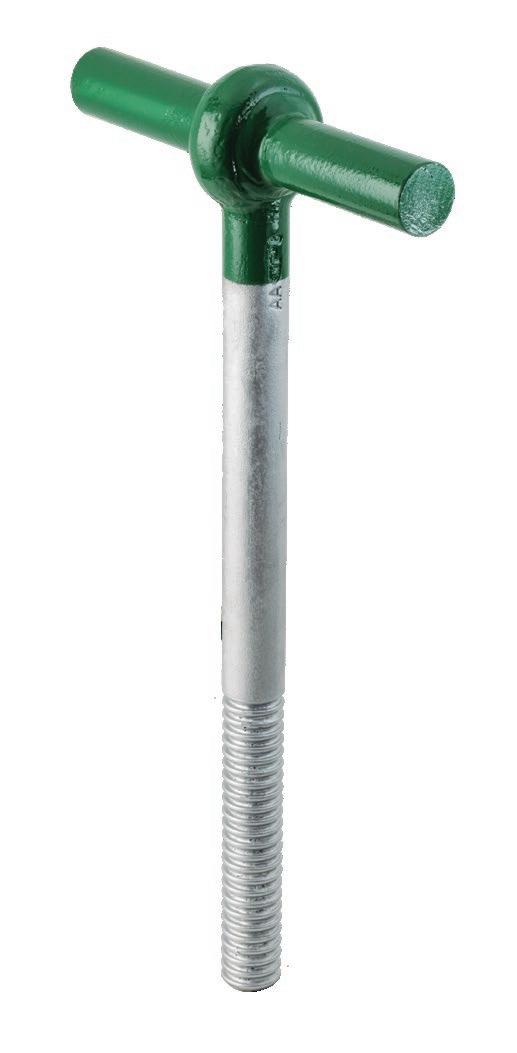
The Green Pin® Mooring Bolt NS9415 T for mooring underwater cages to the seabed, aimed at the burgeoning aquaculture market. This product excels in the safety and security it provides.
This mooring bolt is a grade 8 mooring bolt with a T-shaped end fit-
ting that provides best-in-class quality, guaranteeing absolute security for your mooring system. The mounting depth is indicated by the green color, which makes the installation of the product much easier and the special type of thread will result in a better fixation of the bolt.
The Green Pin® Master Link NS9415 GR8, is a grade 8 master link. The Master Link is certified according to DNV NS 9415 and has a large opening to accommodate larger connecting links. This master link is designed for a one- or two-leg sling.
Green Pin® creates high-end lashing and lifting equipment such as shackles, turnbuckles, hooks and fiber link chain. The raw materials come from high quality suppliers who guarantee full traceability, and the automated production facilities greatly reduce margins of error. Green Pin® products comply with a wide range of internationally recognized standards and are certified by class societies such as DNV. Combined with product quality, Green Pin® offers unrivalled product availability that is fast, global and extremely reliable. The company has an industry-leading stock availability of 99% and is available in more than 90 countries across the globe. Green Pin® products are also accompanied by CAD-drawings, technical documentation, a technical helpdesk, and a suite of technical trainings.
For more information, please visit http://www.greenpin.com.
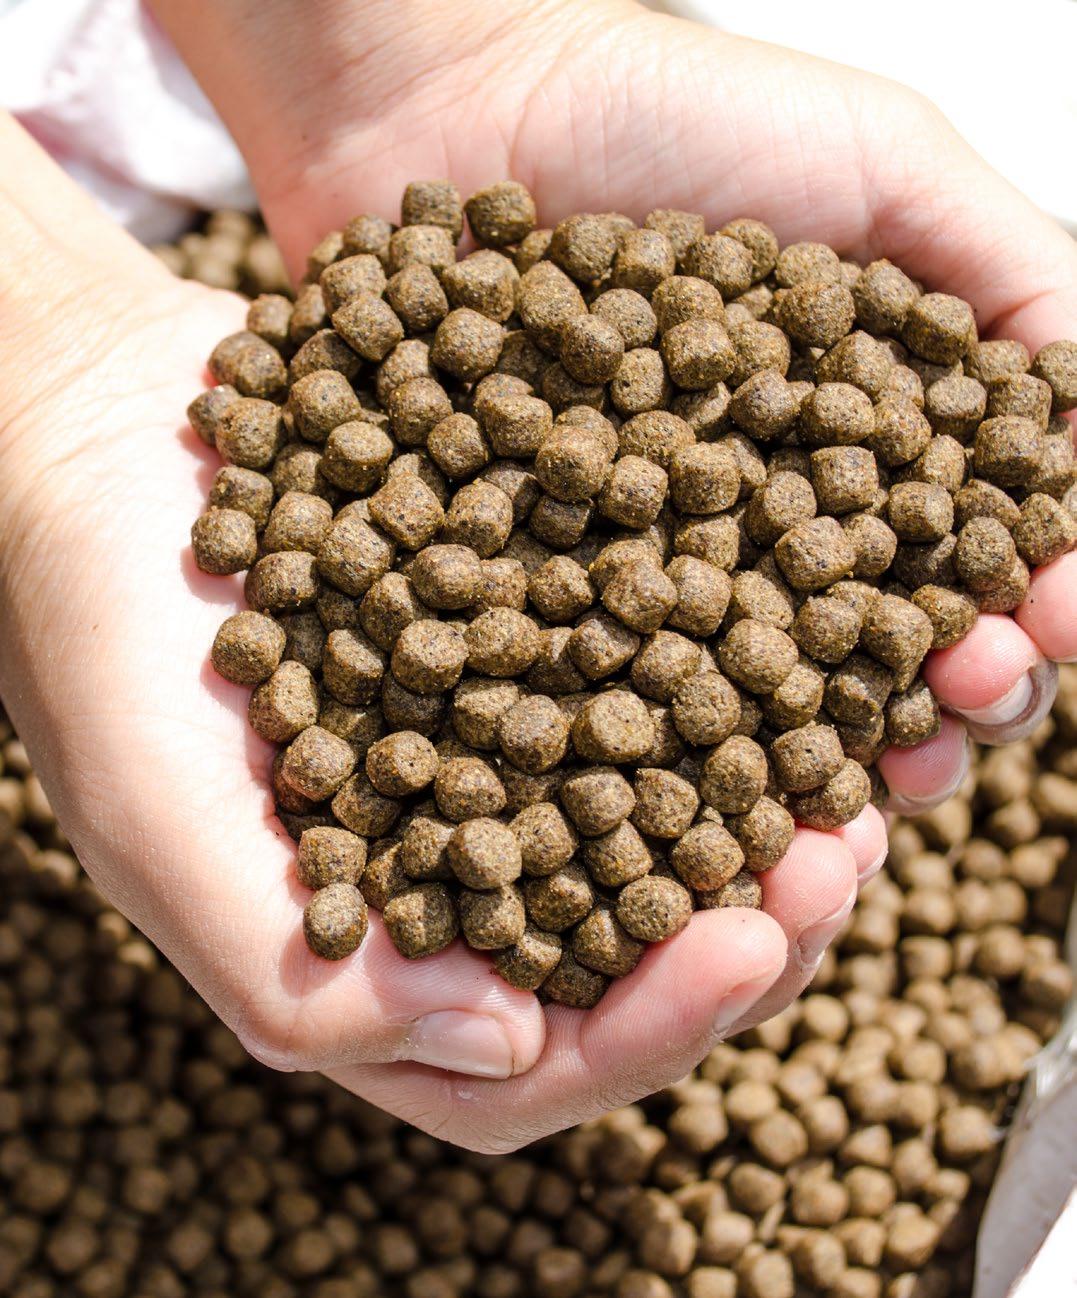
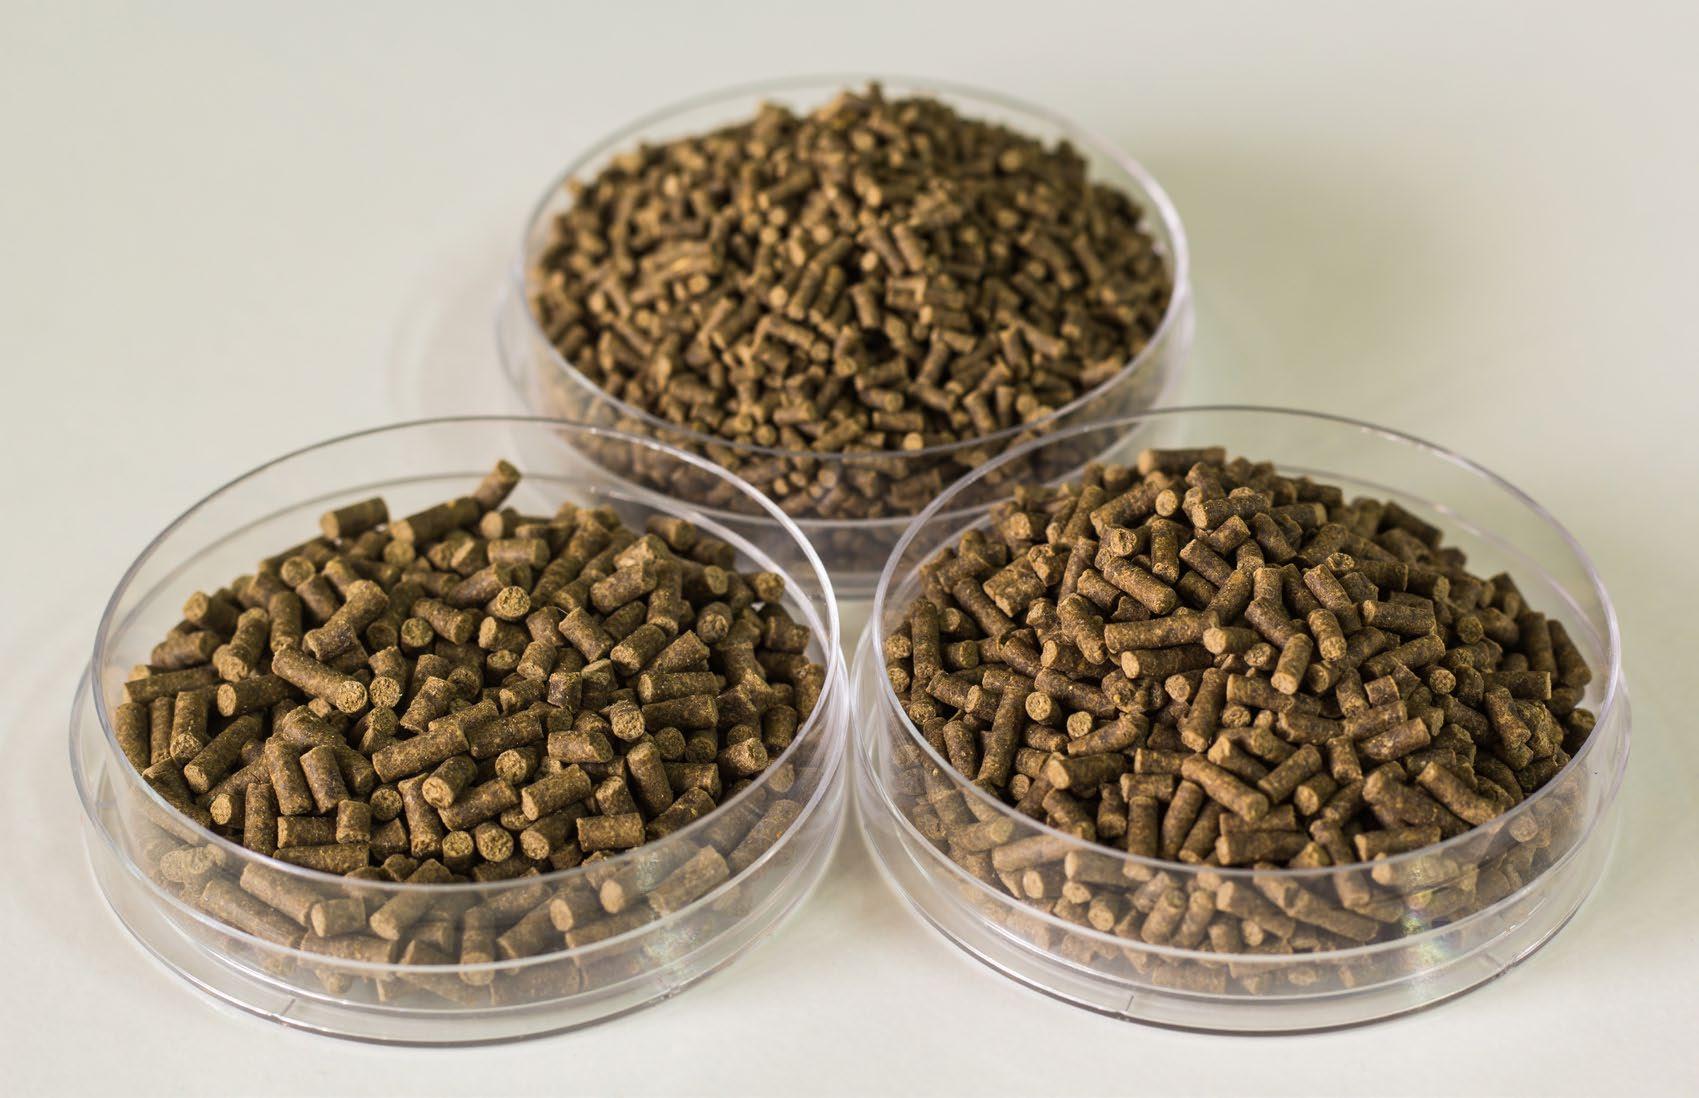
The shrimp feed industry is constantly looking for opportunities to minimize the dependency on expensive fish meal and to keep the industry profitable and sustainable. In this sense we present a work that investigated the optimal levels of fish meal (FML) and dietary methionine (Met) required for maximum growth performance of juvenile Litopenaeus vannamei with economic efficiency.
By: Aquaculture Magazine Editorial Team*Industrially compounded shrimp feeds are among the largest global consumers of fish meal within the aquaculture industry. As a result, replacement of fish meal by other proteins has been the subject of a number of publications. Most studies have supported that dietary fish meal levels can be significantly reduced without adverse effects on shrimp growth performance. Further reduction or complete withdrawal of fish meal from
shrimp feeds has been achieved under experimental culture conditions. However, effective replacement levels vary according to culture conditions, substitute protein, feed formulation, and sources of supplemental amino acids.
The most common proteins adopted to replace fish meal in shrimp feeds are commodity by-products from the animal slaughtering industry (poultry by-product meal; meat and bone meal; porcine meat meal) and agriculture
(soybean meal; soy protein concentrate; canola meal; corn meal; cottonseed meal; peanut meal). Regardless of the protein sources chosen, studies have shown that formulation of low fish meal diets relies on a balanced supplementation of essential amino acids, fatty acids, and feed attractants.
Methionine (Met) is considered the most impacted essential amino acid (EAA) when fish meal is challenged. Recommended dietary Met
levels in shrimp feeds have ranged between 0.7% and 1.0% of the diet (as-fed basis) depending on shrimp species, source of supplemental Met, growth stage, culture conditions, and dietary protein level. However, very little information is available on the optimal dietary Met levels in response to graded levels of fish meal in order to support maximum shrimp growth performance with economic efficiency. The present work evaluated the
growth performance of juvenile Litopenaeus vannamei, the feed digestibility, and the economics of fish meal (FML) reduction with the dietary supplementation of DL-methionylDL-methionine (DL-Met-Met) under intensive culture conditions.
The study consisted of two separate experimental stages. The 1st stage was designed to evaluate shrimp
growth performance fed graded levels of FML and Met. A 2nd stage determined the apparent digestibility coefficients (ADCs) for crude protein (ACPDCs) and amino acids (AAADCs) of diets with graded levels of FML using a fixed dietary Met content. For the growth performance evaluation, an outdoor rearing system was used. The shrimp species used in this study was the Pacific whiteleg shrimp, L. vannamei, purchased as
post-larvae (PLs) from a commercial hatchery (Aquatec Aquacultura Ltda., Canguaretama, Brazil). A commercial grower shrimp feed with 39.25% CP and 6.90% total lipids was used as a reference (CTL). For the economic analysis the cost of formulation of each individual diet was first calculated by using local market prices of each ingredient and feed additives.
In outdoor tanks, shrimp final survival was high (92.7 ± 4.7%) and unaffected by dietary Met content, inclusion level of FML, or their interaction (p > 0.05, Table 1).
Additionally, final survival did not differ between shrimp fed the experimental diets and the CTL (89.7 ± 2.8%). Gained shrimp yield increased progressively with higher levels of FML, from a low of 1,090 ± 54 (0% FML) to a high of 1,166 ± 66 g/ m2 (12% FML). However, yield did not differ statistically when shrimp
were fed diets with 18, 12, or 6% FML, regardless of the dietary Met content. The elimination of FML did not affect yield when compared to shrimp fed 6% FML (1,121 ± 68 g/m2), but it was significantly lower than those fed 12% and 18% FML. The increase in the dietary Met levels from 0.58 (1,127 ± 56 g/m2) to 0.69 (1,145 ± 45 g/m2) or 0.82% (1135 ± 84 g/m2) had no statistical effect on gained yield or a significant interaction with FML level. Shrimp fed the CTL (1,040 ± 33 g/m2) achieved a lower yield compared to those fed diets containing 0.69% Met at all levels of FML, except the highest (18%). At 0.58% Met, higher FML levels were required (12 and 18% FML) to significantly increase yield beyond the CTL. In comparison, at 0.82% Met, there was no significant difference in yield between shrimp fed the CTL and the experimental diets, except when 18% FML was used. In this case, yield was higher for the latter compared to the CTL.
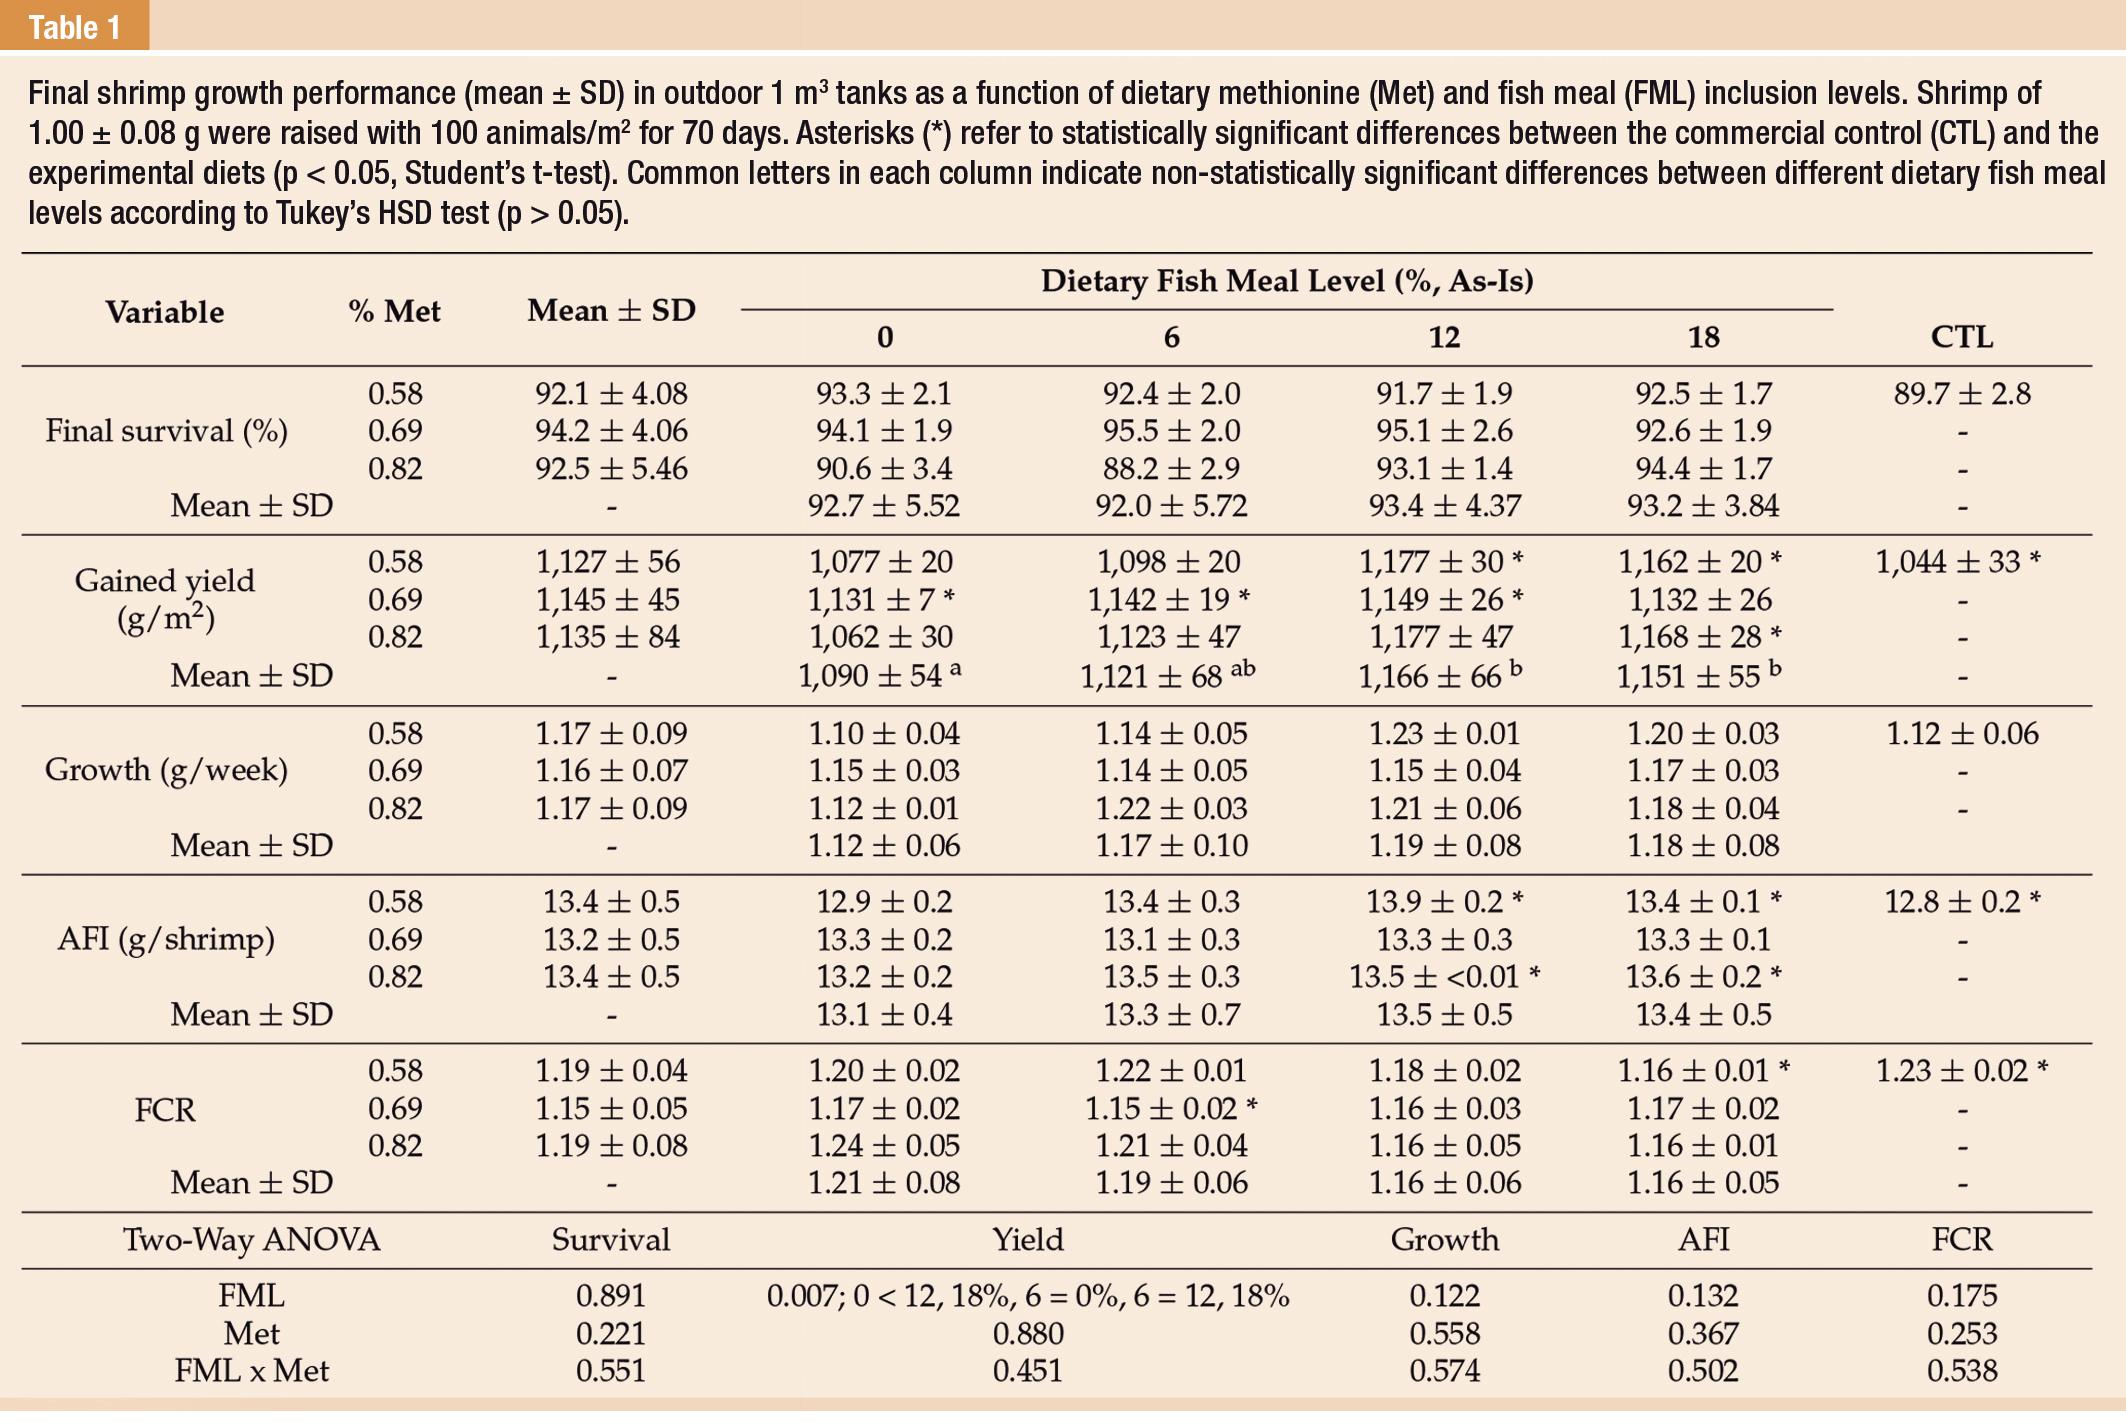
Shrimp weekly growth rate exceeded 1.1 g regardless of the dietary treatment. No difference or significant interaction was detected in growth between shrimp fed different levels of dietary Met and/or FML (p > 0.05). Shrimp fed experimental diets also grew at a similar rate compared to those fed the CTL. Apparent feed intake (AFI) did not differ statistically as a result of FML level or dietary Met content (p > 0.05). FCR was generally low, between 1.15 to 1.22. FCR was also not affected by variations in FML or dietary Met. FCR for experimental diets was within the range of the CTL (1.23 ± 0.02). Exceptions were diets with 6% FML containing 0.69% Met and 18% FML with 0.58% Met, which resulted in statistically lower values compared to the CTL.
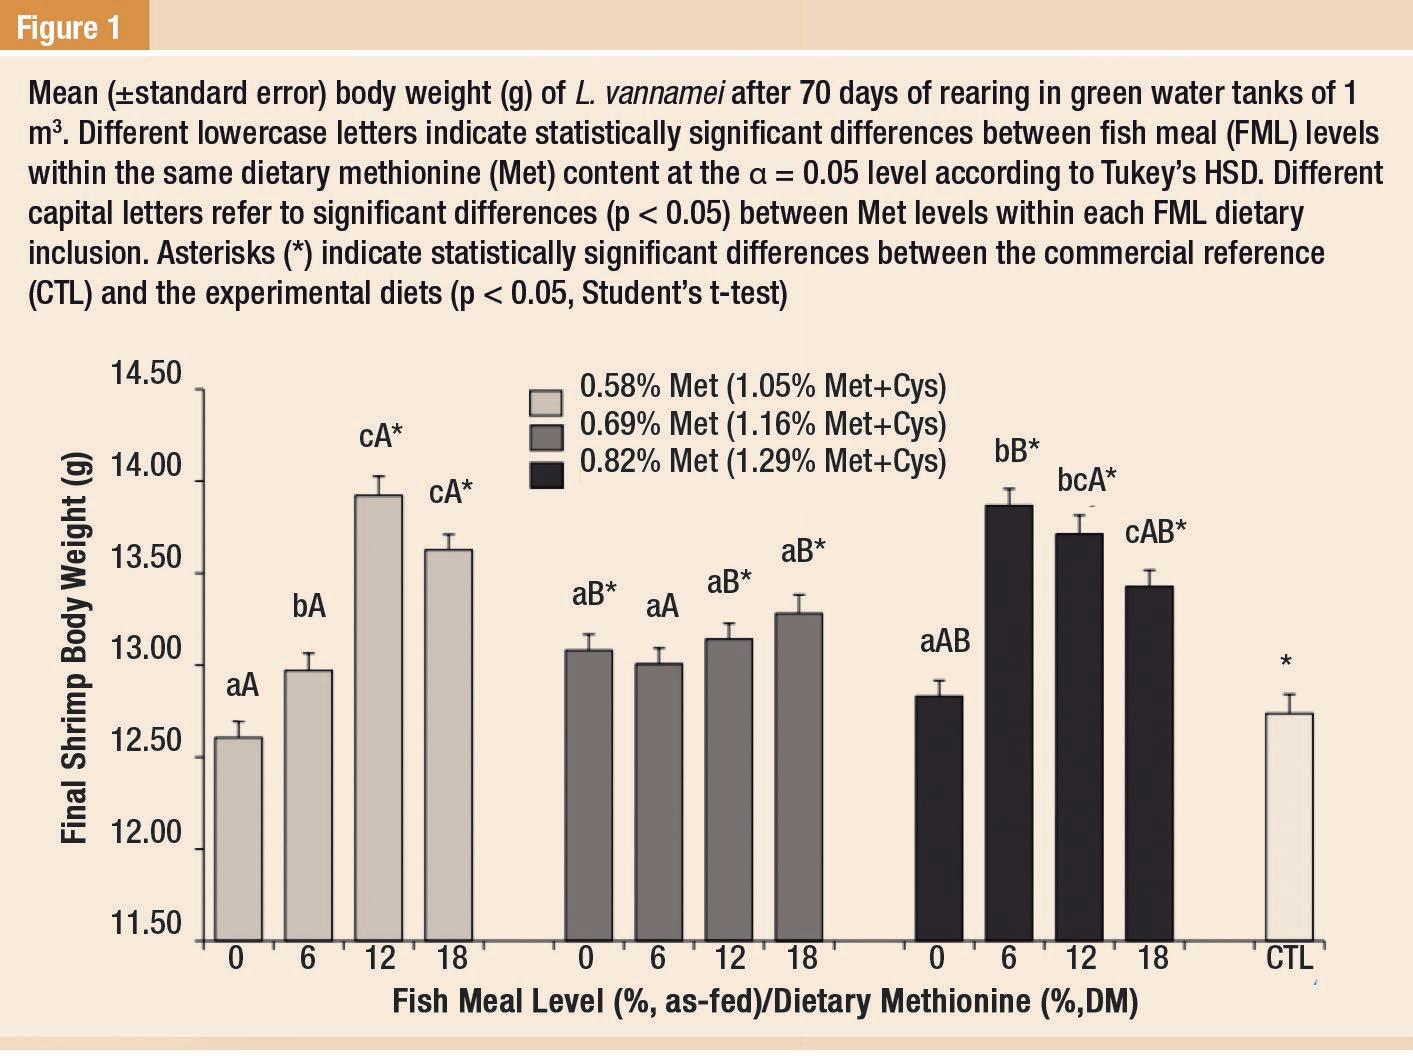
Final shrimp BW (Body Weight) at harvest ranged between 12.61 ± 0.92 (0% FML and 0.58% Met) and 13.92 ± 0.51 g (12% FML and 0.58% Met; Figure 1).
meal is challenged.
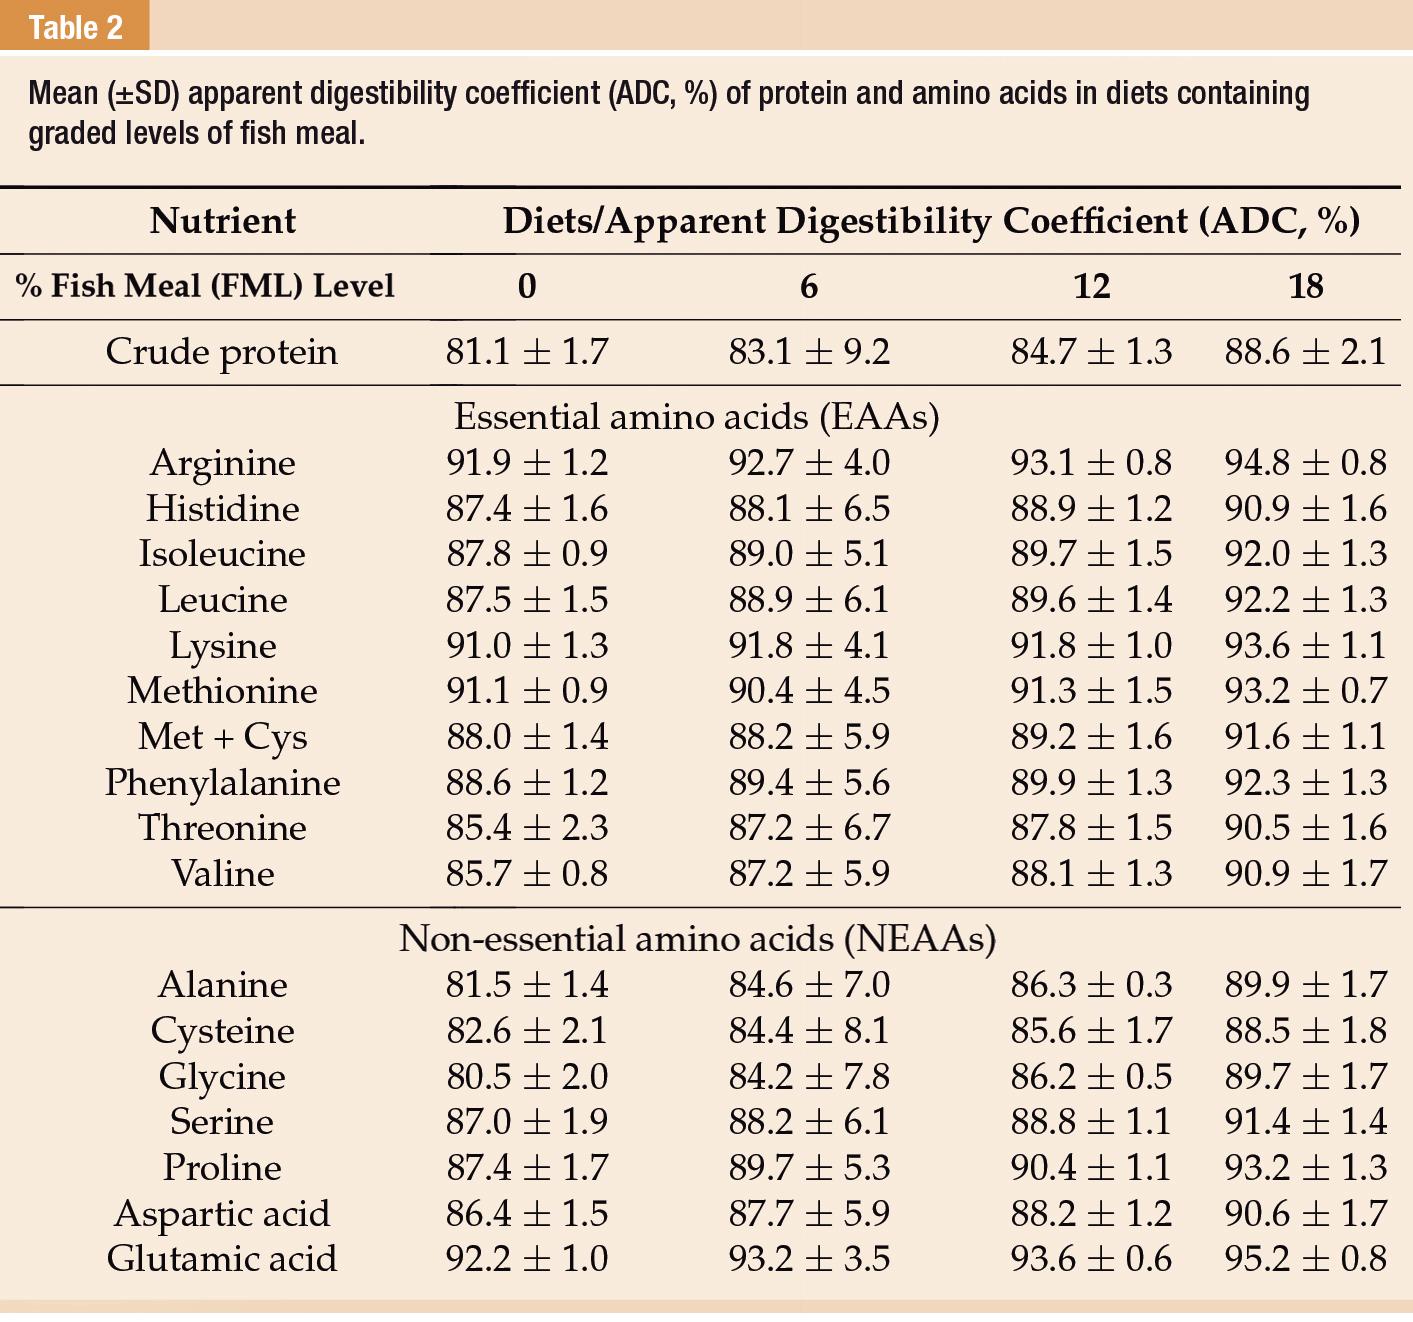
There was an increasing trend towards in apparent crude protein digestibility (ACPDC) with higher dietary inclusion levels of FML (Table 2). ACPDCs varied from a minimum of 81.1 ± 1.7% for shrimp fed a diet without FML to a high of 88.6 ± 2.1% for 18% FML.
The apparent amino acid digestibility coefficients (AAADCs) followed a similar fashion for both EAAs and non-essential AAs (NEAAs). In indoor tanks, shrimp fed a diet deprived of FML achieved the highest final survival compared to other dietary treatments. Survival reached a mean of 87.5 ± 7.8% (p > 0.05). At harvest, shrimp fed 0% FML grew at 0.62 ± 0.04 g/week and
Methionine (Met) is considered the most impacted essential amino acid (EAA) when fish
Under outdoor and indoor tank conditions, the optimal dietary FML level without an adverse effect on the growth performance of L. vannamei was reached at 6%.
achieved 12.69 ± 0.55 g final BW, both significantly lower than other dietary treatments (p < 0.05). However, no statistically significant differences were detected for gained shrimp yield (557 ± 80 g/m2) and FCR (2.68 ± 0.37). There was a significantly lower AFI when shrimp were fed 0 and 6% FML, but the later did not differ statistically from 12% and 18% FML (p > 0.05).
Total shrimp production cost, gross revenue, profit, and return on investment (ROI) were driven by FCR, yield, shrimp final BW, and formula costs, i.e., feed sales price. Formulation costs ranged from a minimum of 0.706 (0% FML with 0.56% Met) to a maximum of 0.943 USD/kg (18% FML with 0.82% Met). The dietary inclusion of FML and total Met content both affected formula costs.
A reduction in FML from 18 to 12, 6%, and 0 at 0.69% dietary Met resulted in formula savings of 6.2,
13.3, and 23.1%, respectively. The increase in dietary Met content within the same level of FML also raised formula costs. However, the increase was less critical. Raising total Met content from 0.58 to 0.69 and 0.82% in diets deprived of FML impacted formula costs at 0.7 and 1.5%, respectively. A similar increase in formula cost was observed with 18% FML.
Raising shrimp with a diet containing 18% FML led to the lowest ROI, at 14.3 ± 6.4%. Interestingly, the highest ROI was obtained with diets containing no or only 6% FML (33.2 ± 8.4% and 26.5 ± 7.9%, respectively). At no FML, ROI was significantly higher than 12% and 18% FML. At moderate levels of dietary inclusion, i.e., 6% and 12% FML, no differences in ROI could be observed.
This study has demonstrated that dietary FML levels and Met (Met + Cys) content and their interaction significantly impact final shrimp
BW. The responses in BW as a function of FML level varied according to the dietary Met (Met + Cys) content. At the lowest dietary Met (Met + Cys), i.e., 0.58% (1.05%), it was observed that FML could only be reduced from 18% to 12%. Further reductions led to a reduced shrimp BW at harvest. At moderate levels of dietary Met, i.e., 0.69% (1.16%), FML could be completely eliminated without any impact to shrimp BW, but with an adverse effect on yield. In comparison, at the highest dietary Met, i.e., 0.82% (1.29%), FML could be reduced from 18% to 6%, but complete withdrawal negatively impacted BW. Therefore, the levels of dietary Met (Met + Cys) required to maximize shrimp BW at 0 and 6% FML ranged between 0.69 (1.16) and 0.82% (1.29%), while at 12% and 18%, only 0.58% (1.05%) was needed.
Under outdoor and indoor tank conditions, the optimal dietary FML level without an adverse effect on
the growth performance of L. vannamei was reached at 6%. This finding is corroborated with the work of Suárez et al. (2009), who raised juvenile L. vannamei (0.3 ± 0.1 g) under clear-water conditions for 95 days.
From the economic point of view, eliminating FML was as competitive as including 6% FML, with both being more advantageous than 12 and 18% FML. The production costs of diets containing lower levels of FML exceeded the benefits of a higher revenue, resulting in greater profit and ROI. The cost of FML was the main driver for a higher production cost recorded for diets 12 and 18% FML. In comparison, total dietary Met content had no effect over economical parameters, including production costs.
Results show that a correct balance of FML and dietary Met has a critical effect on whiteleg shrimp
performance. Shrimp final survival, growth, FCR, and the dietary protein and amino acid digestibility were not negatively affected by a reduction or complete elimination of FML with a proper balance with CAAs, including Met. However, while gained shrimp yield is reduced when FML is withdrawn, dietary inclusion levels of 12% or higher leads to increased costs, which are not offset by higher revenues. In conclusion, the total amount of dietary Met needed to maximize shrimp growth performance depends on the amount of dietary FML. Higher amounts of supplemental DLmethionyl-DLmethionine reduces the reliance on FML. A total dietary supplementation of DL-Met-Met of 0.34% can reduce FML inclusion from 18 to 6% without any negative effect on shrimp performance. Overall, results indicate that the use of FML can be minimized or completely eliminated without major detrimen -
tal effects on shrimp performance, as long as methionine requirement is met with proper supplementation of CAAs. Feeds with 0 FML or with only 6% with levels of dietary Met (as-fed basis), i.e., 0.69 and 0.82%, respectively, deliver the highest shrimp growth performance, profit, and return on investment compared to diets with higher levels.
Increasing per capita demand for seafood is predicted over coming decades despite static fisheries supply. The Aquaculture Adoption Index considers national production relative to consumption and may be predictive of nations where supply instability may occur or, where uptake could benefit food security.
 By: Aquaculture Magazine Editorial Team*
Introduction
Increasing per capita demand for seafood (here, covering all aquatic foods produced in freshwater, brackish and marine water systems) is predicted over coming decades despite static fisheries supply. Aquaculture may fill the gap but generally falls below national demand. Lowest production occurs where seafood consumption is negligible or where provision is from fisheries and imports. The Aquaculture Adoption Index considers national production relative to consumption and may be predictive of nations where supply instability may occur or, where uptake could benefit food security.
Global mean per capita consumption of seafood is at its highest level since records began in the 1960s. In 2019 almost half of global supply (some 90 million tonnes) came from the rapidly expanding aquaculture sector —the remainder from a relatively static wild fishery. Further expansion in per capita consumption will conflate with increasing global affluence to further drive demand to 2050; the required doubling in volume expected to be met by increased aquaculture. Expansion in aquaculture has potential to not only improve nutritional security for millions of people but also
offers significant potential as a ‘low stressor’ component of integrated food systems. Here we assess national disparities in seafood consumption (volume, type) and place these in context with relative uptake of aquaculture at national level as a potential means of provisioning future seafood demand.
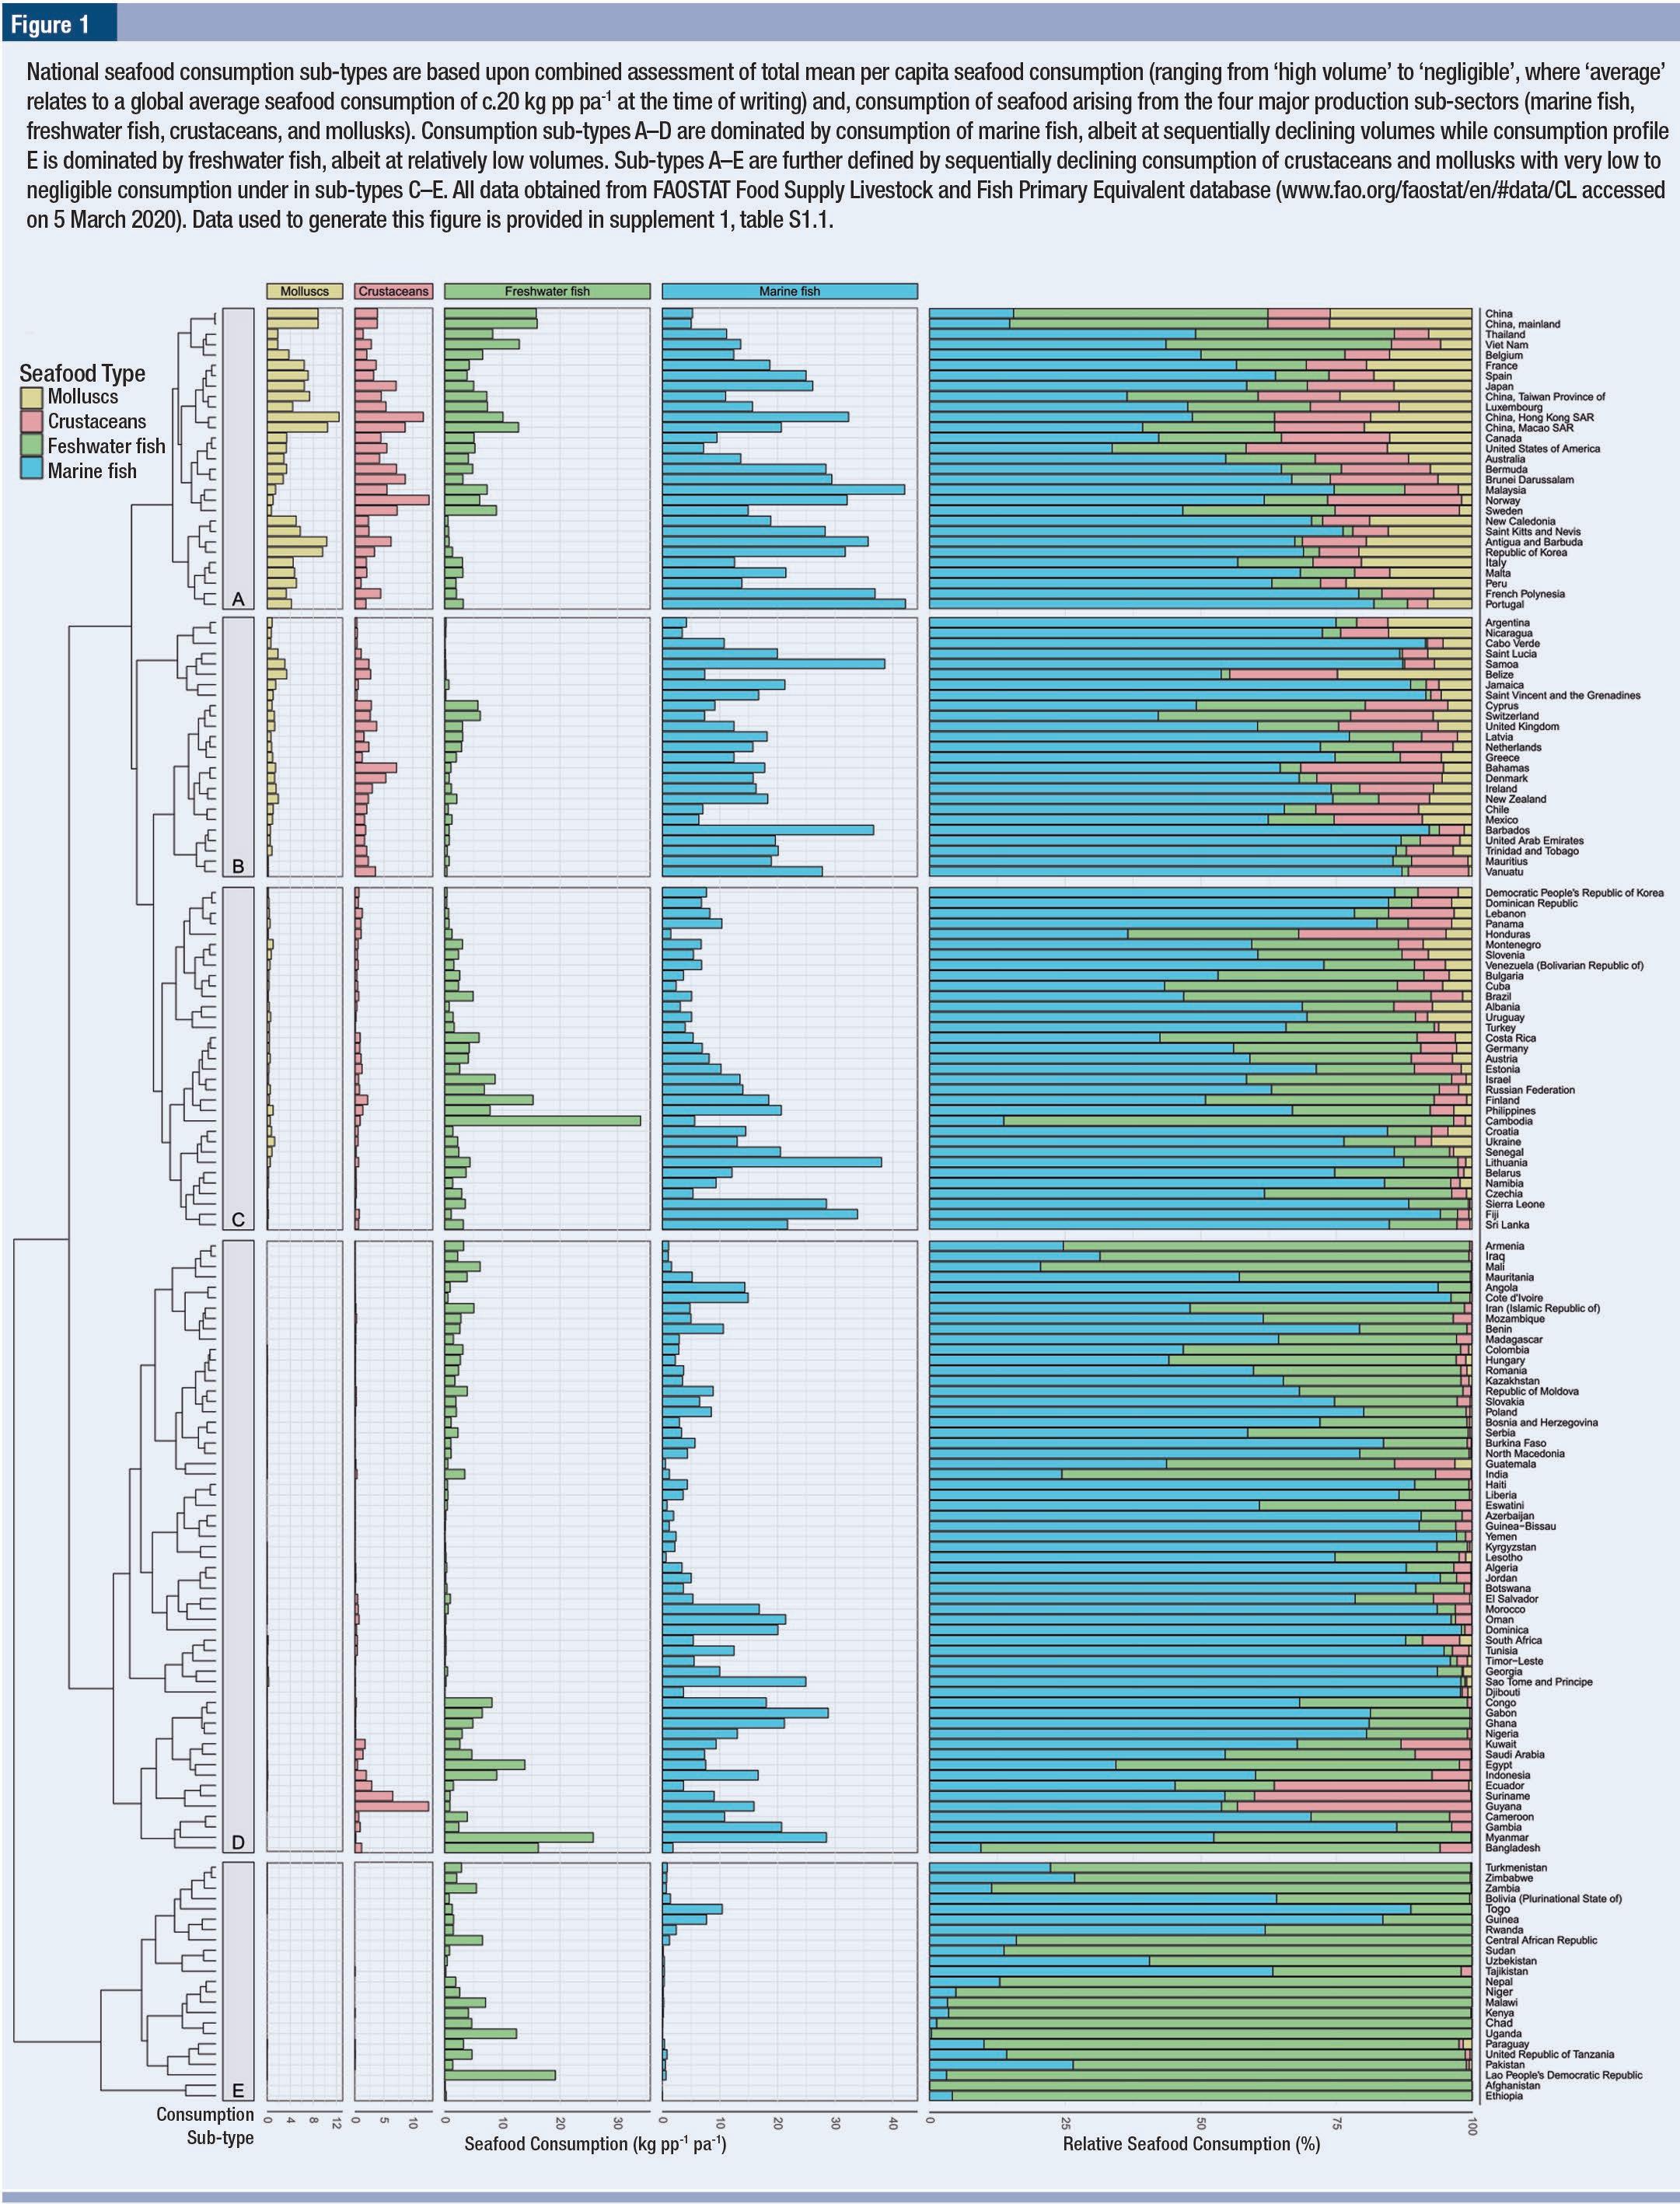
Seafood from animal sources broadly comprises marine fish, freshwater fish, crustaceans, and mollusks. Cluster analysis of per capita seafood consumption data available for 175 nations proposes five major national consumption sub-types (A–E) based upon the volume and type of seafood consumed by citizens of those nations (Figure 1). Sub-type A and B nations display volumetric consump-
tion above the global average (c. 20 kg pp pa 1), dominated by marine fish but with access to other diverse seafood types. Sub-type C and D nations consume below average volumes of mainly marine fish with a decreasing propensity for diversity in seafood type consumed. Sub-type E nations consume negligible volumes of seafood (often <2 kg pp pa 1), dominated by freshwater fish. Reasons for differences in consumption pattern are complex and multi-factorial but include availability of locations where fisheries and aquaculture can operate, wealth and demographic profile of citizens, dynamics in the global trading of seafood and religious or cultural practices relating to inclusion of seafood in national diets.
While excellent data resources exist for fisheries and aquaculture production at national, regional, and global levels, few analyses to date have focused on country-level uptake of aquaculture relative to the seafood consumption habits of those nations. For this, national per capita aquaculture production was normalized against national population size— facilitating a more meaningful transnational comparison in relative aquaculture uptake than production volume, alone. Per capita aquaculture output as a proportion of total national seafood demand, from 159 nations for which data are available, can be classified as—type 1 (>100% of national demand), type 2 (>50%–100%), type 3 (>25%–50%), type 4 (5%–25%)
Seafood from animal sources broadly comprises marine fish, freshwater fish, crustaceans, and mollusks.
and type 5 (<5%). When combined with national consumption profiles (Sub-types A–E, above) the resultant Aquaculture Adoption Index (AAI) clusters nations to one of 25 categories according to volume and types of seafood consumed and, the theoretical relative contribution of aquaculture production to overall national seafood demand (Figure 2). Due to prolific global trading in seafood the AAI does not presume that national aquaculture production directly provisions seafood demand at the national level. Instead, it offers insight on uptake of aquaculture in national waters relative to the importance of seafood in the diet of that nation —a potentially important measure when assessing future aquatic food security at national level.
Globally, 13 nations support aquaculture sectors which produce more than 100% of their national seafood demand —a further 12 producing over 50%. Conversely, 111 nations support aquaculture sectors producing less
than 25% of their current demand, 62 of these with production below 5% (Figure 2). Highest and lowest per capita production from aquaculture relative to national consumption occurs in Chile (579.6%) and Belgium (0.03%), respectively. Norway is the highest per capita producer of seafood from aquaculture (270.1 kg pp 1 pa 1), albeit with a higher relative national consumption of seafood (52.04 kg pp 1 pa 1) than in Chile (10.75 kg pp 1 pa 1).
Regional patterns in aquaculture adoption also exist. Of 41 African nations for which data are available, 37 produce less than 25% of their national seafood demand from aquaculture —27 of these below 5% and, in many cases, coinciding with low to negligible seafood consumption (sub-types C, D and E; Figures 1 and 2). Conversely, Asia has the highest number of countries producing at least 50% of national seafood demand from aquaculture —including several of the largest global producers by volume (e.g. Chi-
Globally, 13 nations support aquaculture sectors which produce more than 100% of their national seafood demand.
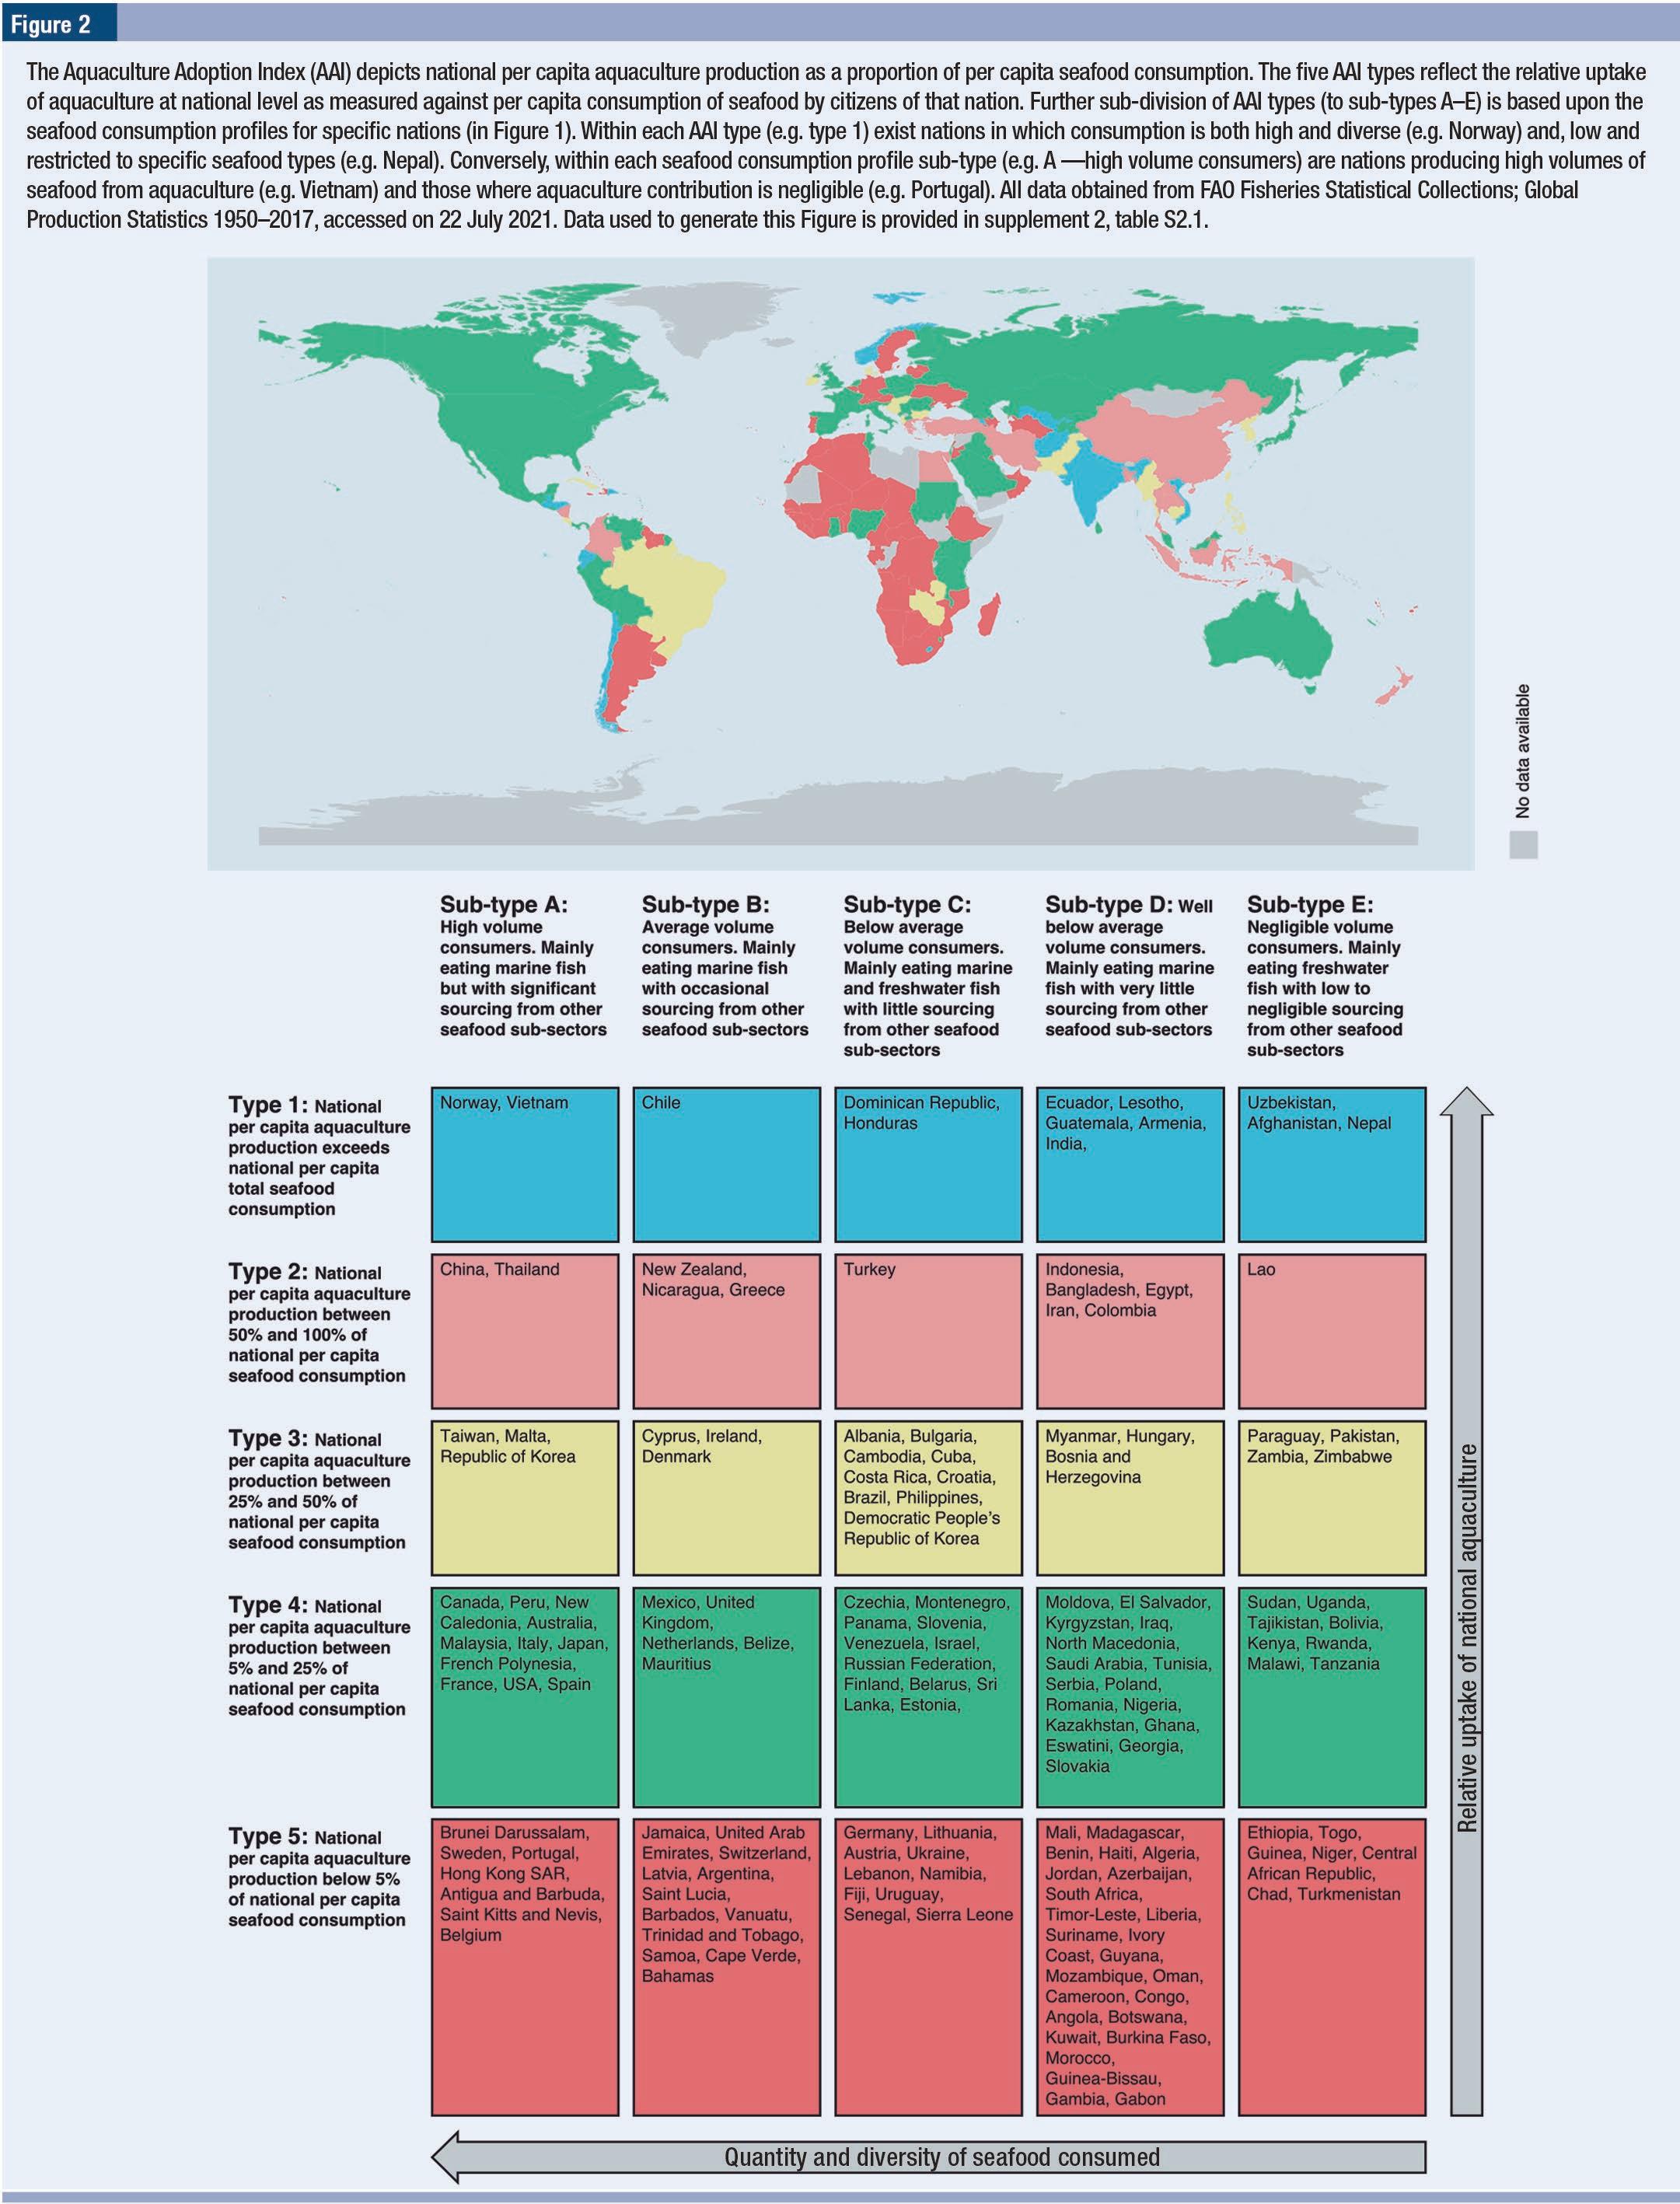
na, India, Indonesia, Vietnam, Thailand, Bangladesh). Despite this, 20 of the 41 Asian nations for which data are available produce less than 25% of their national seafood demand from aquaculture —half of these below 5%. Europe is dominated by nations producing less than 50% of their national seafood demand from aquaculture —27 of the 37 nations producing below 25%. A similar pattern exists in the Americas, albeit with five nations in Latin America (e.g. Ecuador) where per capita aquaculture production exceeds national seafood demand. Island states in the Caribbean (e.g. Barbados) are generally depicted by high national seafood consumption and very low (<5%) aquaculture production. Within Oceania, 6 of the 7 nations for which data are available produce less than 25% of their national seafood demand from aquaculture, only New Zealand reaching near parity between seafood demand and aquaculture output (Figure 2).
Country-level seafood consumption data does not discriminate between that sourced from capture fisheries versus aquaculture, nor the net contribution of imports. However, modelling of international seafood trade flows has estimated equal contributions of fisheries and aquaculture (c. 41%, 2011 data) to direct human consumption, a further 17% contribution from fishery products processed to fishmeal for use in aquaculture feeds and, significant dependence of the EU, USA, and Japanese markets on imports for consumption. Guillen et al. (2019) proposed that accountability for sustainability of national seafood supply should thus be defined by the ‘seafood consumption footprint’ of that nation, rather than by its production alone. The AAI extends this proposition by considering the specific provisioning of seafood from aquaculture relative to current national seafood demand. Subsequently, it may be appropriate for application in national-level aquatic food strategies where the aim is to: (a) develop aquaculture production in a propor-
tional and representative manner relative to national seafood consumption needs (e.g. species choice, scale, product type), (b) directly account for the footprint of seafood consumption of that nation (i.e. by reducing the ‘offshoring’ of production impact to exporting nations), (c) protect against imported seafood supply chain failure or other disruptions or disputes with potential to impact trade, (d) position the national aquaculture sector within the wider aquatic and terrestrial food system of the nation and, (e) harness wider benefits of sustainable aquaculture development at national level (e.g. quality employment, wealth generation, food security, protection of biodiversity, climate resilience).
The global aquaculture sector has matured over the past two decades as a major food sector but still faces significant challenges as a provider of sustainable protein. As aquaculture looks set to dominate the provision of global seafood supply by 2050, understanding relative adoption of aquaculture to seafood demand at national level will become an important measure in assessing sustainability of supply at country-, regional- and globallevels.
9 Per capita consumption of seafood varies considerably by country, both in volume and diversity of types consumed.
9 Cluster analysis revealed five major per capita consumption subtypes, ranging from high volume consumers of mainly marine fish (sub-type A) to negligible volume consumers of mainly freshwater fish (sub-type E).
9 Aquaculture uptake (measured in terms of per capita production at national level) was compared to per capita seafood consumption to create the AAI.
9 Five AAI Types were described — ranging from those nations whose aquaculture sector produced.
9 >100% of national per capita seafood consumption to those
nations where less than 5% of current demand is represented by the existing national industry.
9 Although we do not presume that national aquaculture production provisions national consumer demand directly, the AAI provides an insight in to the national appetite to deploy aquaculture relative to national dietary reliance on seafood.
Consumption profiles (Figure 1) were created using data from FAOSTAT (data provided in supplement 1, table S1.1). Consumption values (kg pp 1 pa 1) were transformed to a log (10) scale where 0 values are given a pseudo value of and grouped according to hierarchical clustering. Countries were assigned to one of five types (A–E) based on dendrogram clusters, visualized with modular leaf ordering. Accompanying bar charts display actual consumption values (kg pp 1 pa 1) followed by proportional contribution of seafood sector consumption (by % of total). Maldives, Kiribati, and Iceland were removed from the analysis based on relatively high values of marine fish consumption compared to other nations. Grenada, Solomon Islands and Mongolia were removed as almost sole consumers of marine fish. The world map was plotted with the ‘sf’ and ‘rnaturalearth’ packages in R. For generation of AAI types (1–5), national per capita seafood consumption data were used to calculate the differential —AAI types defined according to the proportion of current per capita seafood consumption represented by current per capita production (data are provided in supplement 2, table S2.1).
This is a summarized version developed by the editorial team of Aquaculture Magazine based on the review article titled “GLOBAL ADOPTION OF AQUACULTURE TO SUPPLY” developed by: STENTIFORD, G.D.-Centre for Environment, Fisheries and Aquaculture Science (Cefas) and University of Exeter, HOLT, C.C.-University of British Columbia. The original article was published, including tables and figures, on APRIL, 2022, through ENVIRONMENTAL RESEARCH LETTERS. The full version can be accessed online through this link: 10.1088/1748-9326/ac5c9f.
 By: Aquaculture Magazine Editorial Team*
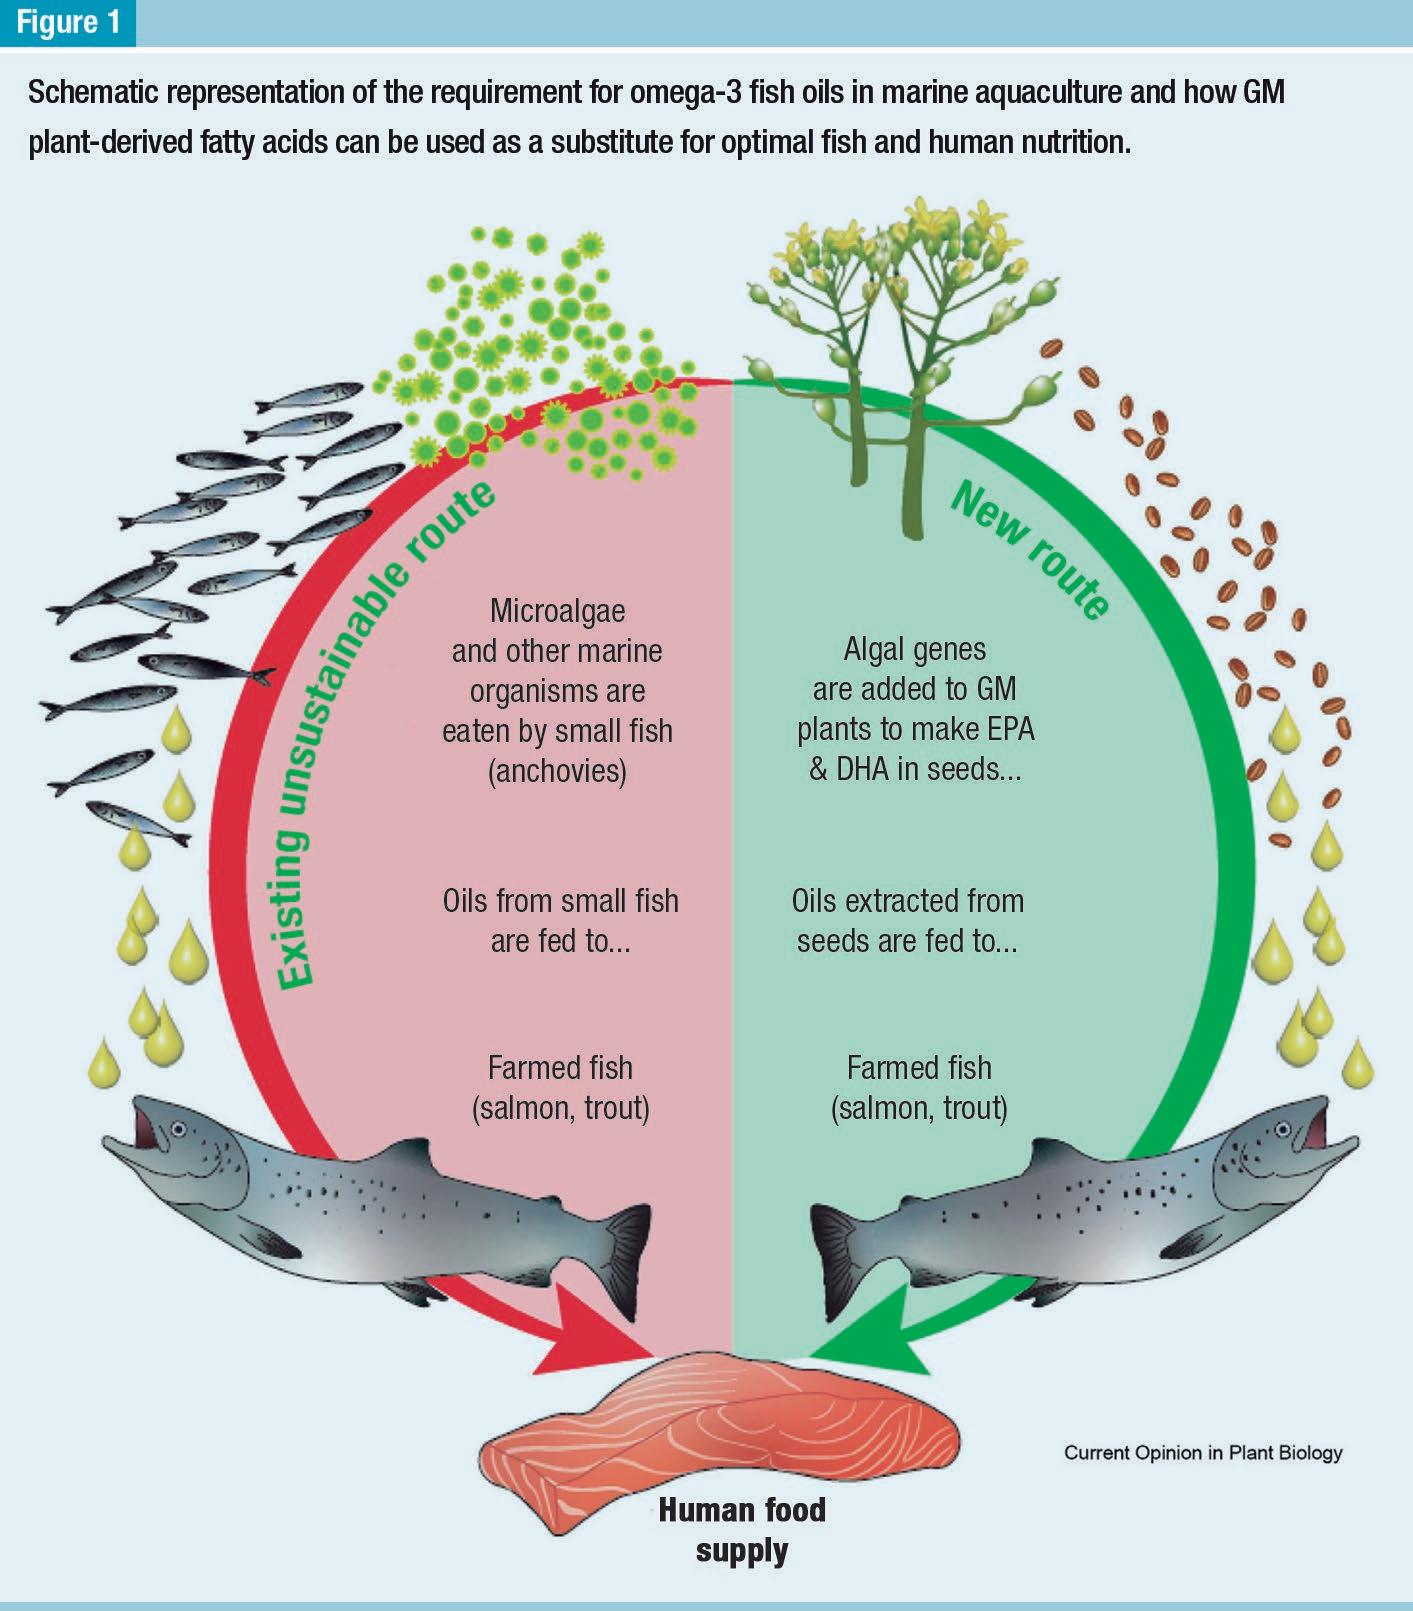
There is a growing recognition of the challenges associated with ensuring good nutrition for all without compromising the environment. This is particularly true for aquaculture, given the reliance on marine extraction for key feed ingredients, yet at the same time it delivers key nutrients such as omega-3 long chain polyunsaturated fatty acids. This review will consider progress in transitioning away from oceanic-derived fish oils as feed ingredients, focusing on the emerging transgenic plant sources of these fatty acids.
The health-benefits associated with a diet containing oily fish rich in omega-3 long chain polyunsaturated fatty acids (omega-3 LC-PUFAs) are now well-established, linking regular consumption of these fatty acids with reduced risk of cardiovascular disease and myocardial infarction. However, many factors have conspired to make this apparently easy recommendation less easy to fulfil, including the relentless growth in the global population which puts increasing demands on our planet’s finite resources, pollution of the marine environments and advancing climate change. Perhaps counterintuitively, the growth in aquaculture as the dominant farming system to produce fish for human consumption, has altered the dynamics of omega-3 supply and demand,
putting additional strain on finite global fish stocks.
As discussed below, efforts to make aquaculture more sustainable have lowered the nutritional value of the final product. In this sense, the inclusion of terrestrial plant oils, the main alternative to fish oil in Europe, in aquafeeds has led to a marked reduction in the levels of omega-3 LC-PUFAs accompanied by increased levels of short chain fatty acids characteristic of terrestrial systems. Long established dietary patterns have radically shifted in the last few decades, to the point that metabolic diseases resulting from the overconsumption of calorierich but low nutrient diets outweighs (no pun intended) the number of people suffering from poor nutrition due to insufficient food. Simultaneous to that, a growing awareness that global
patterns of food consumption are exceeding planetary boundaries has also led for calls in a radical shift in how we feed ourselves, most notably with a strong decrease in the consumption of (terrestrial) animal protein and concomitant increase in dietary plant protein. Interesting, elevated consumption of fish is also recommended (because of the nutritional benefits of omega-3s etc.) but there is an inherent tension associated with such advice, not least of all with respect to sustainability of global fish stocks.
Plant biotechnology has always aspired to deliver benefits to society, even if this has sometimes not been obvious. The first wave of GM crops developed in the 1990s was focused on delivering so-called input traits, which help farmers (via herbicide tolerance and/or herbivore resistance) but pro-
vide no direct benefit to the consumer or nutritional enhancement (although they do deliver a reduced reliance on chemical inputs). A second wave of output traits for improved nutrient content is only now starting to appear, 25 years behind the entry-level features are the many and varied reasons for this have been studied recently by us and others. At the forefront of these new GM crops are plants which have been engineered to accumulated omega-3 LC-PUFAs in their seed oils, providing a novel terrestrial source of this important fatty acids independent of marine stocks such plant-based sources of “omega-3 fish oils” can be used for both direct human nutrition or as animal feed ingredients (in either aquaculture or terrestrial animals), delivering benefit by these different routes.
The omega-3 LC-PUFAs, eicosapentaenoic acid (EPA; 20:5∆5,8,11,14,17) and docosahexaenoic acid (DHA; 22:6∆4,7,10,13,16,19) are found in fish oils and are almost exclusively restricted to aquatic foodwebs. The predominant biosynthesizers of EPA and DHA in the marine ecosystems are microalgae and other phytoplankton, with the fatty acids accumulating in the multiple trophic levels above these founders. Marine and salmonid fish species have little or no endogenous capacity to synthesise these fatty acids, relying instead on dietary intake. No angiosperm plant species have the capacity to synthesise EPA and DHA, although C18 precursor polyunsaturated fatty acids are ubiquitous in the Plant Kingdom. Since the 1990s, significant efforts have been made towards engineering plants to accumulate EPA and/or
The largescale culture of algal strains remains a challenge, in terms of economics and infrastructure.
DHA as an alternative to marine extraction. Representing one of the very few projects to progress first from a discovery phase into application, the production of omega-3 fish oils in transgenic plants represents a significant achievement for plant biotechnology. This short review will concentrate on recent examples of scale-up and translation, including demonstration of efficacy in aquafeed trials. Aspect of the molecular biology and genetic toolkits that have been used to generate these transgenic plants have been recently considered elsewhere and are therefore only discussed briefly.
Despite being a deceptively straightforward objective, the efficient synthesis of the non-native fatty acids
EPA and DHA proved challenging to achieve, especially when accumulation was restricted to storage triacylglycerols via seed-specific promoters. This was due in part to the relative complexity of the biosynthetic pathway, requiring the co-ordinated expression of a minimum of five heterologous genes, representing some of the most complex metabolic engineering attempted in transgenic plants. However, by adopting an iterative approach to defining the optimal combination of genes and regulatory elements, significant progress has been achieved in two host species, Camelina and Canola. Interesting, it has also become apparent that endogenous metabolism plays a key role in enabling the effective reconstitution of the omega-3 LC-PUFA biosynthetic pathway and this inherent capability varies between species. For example, the successful synthesis of EPA + DHA in Arabidopsis or Camelina via the so-called alternative pathway was not recapitulated in peanut.
Even in the case of effective oilseed chasses such as Canola and Camelina, there are significant differences between the species e for example, a very similar suite of genes and regulatory elements was used to direct the synthesis of EPA + DHA, resulting in ⁓20%EPA + DHA in Camelina but only 8% EPA and 1% DHA in Canola. This may indicate additional levels of control, which could include transgene integration site, post-transcriptional regulation, enzyme turnover and substrate channeling. Independently
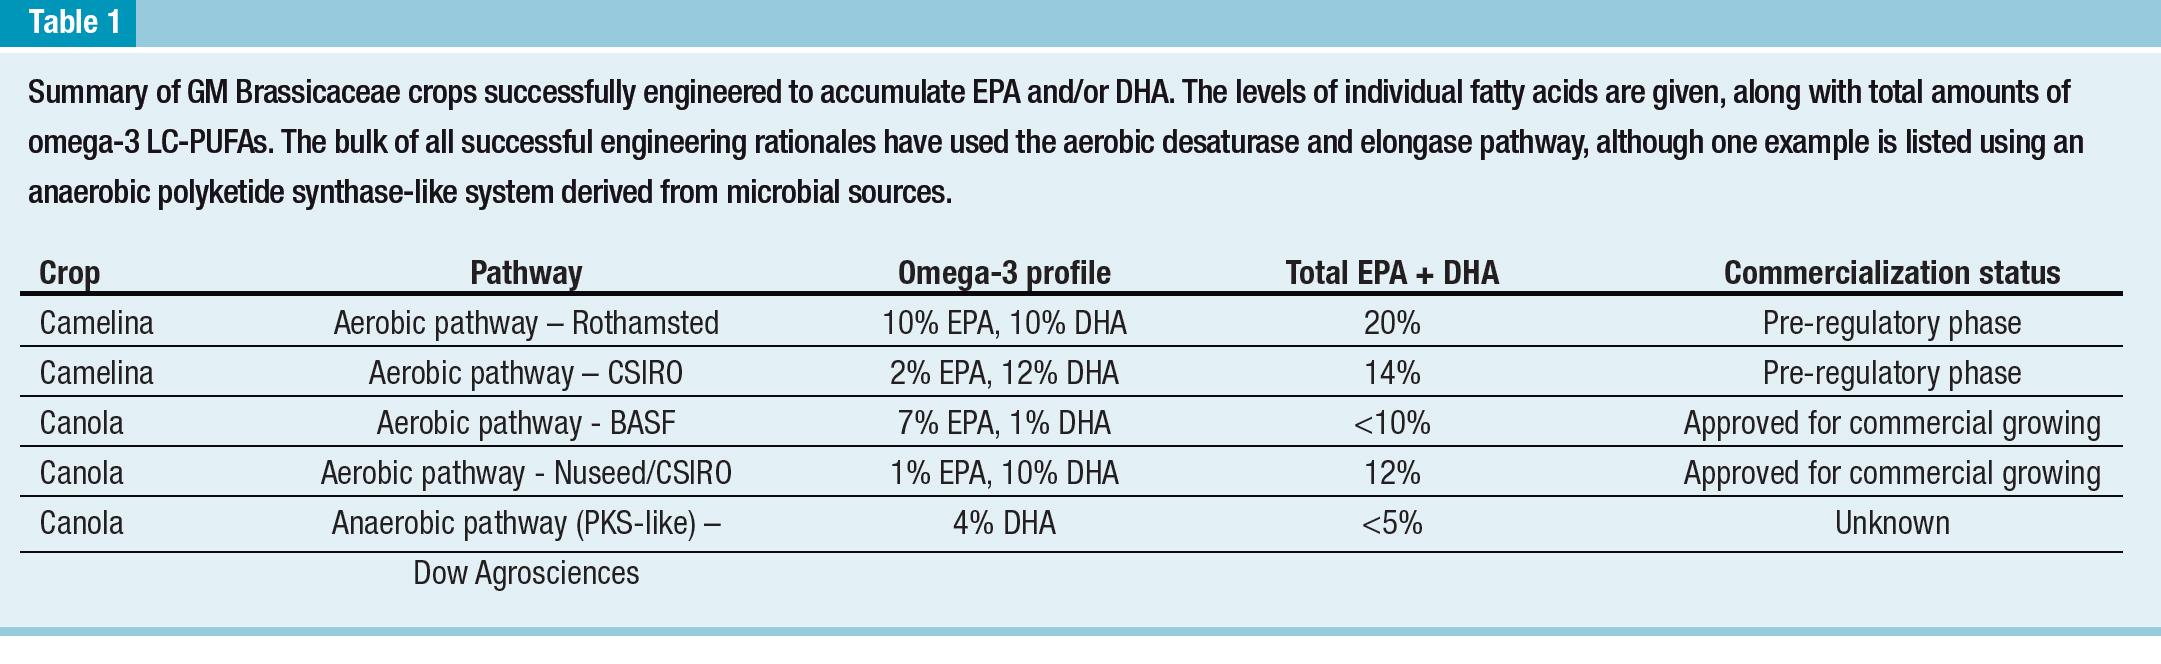
of these open questions, it is clear that Brassicacea oilseeds are excellent hosts for the transgenic accumulation of omega-3 LC-PUFAs (summarized in Table 1) and the oils derived from these crops have been used in multiple aquafeed trials. Importantly, the realworld performance of these crops has been demonstrated by multi-location field trials across different continents. Recently, gene-editing has been used in conjunction with transgenesis to enhance the accumulation of EPA + DHA in Camelina via the inactivation of a competing endogenous pathway.
One key aspect of achieving the successful translation of the biotech studies described above is to validate these novel oils as effective substitutes for fish oils in the diets used in aquacul-
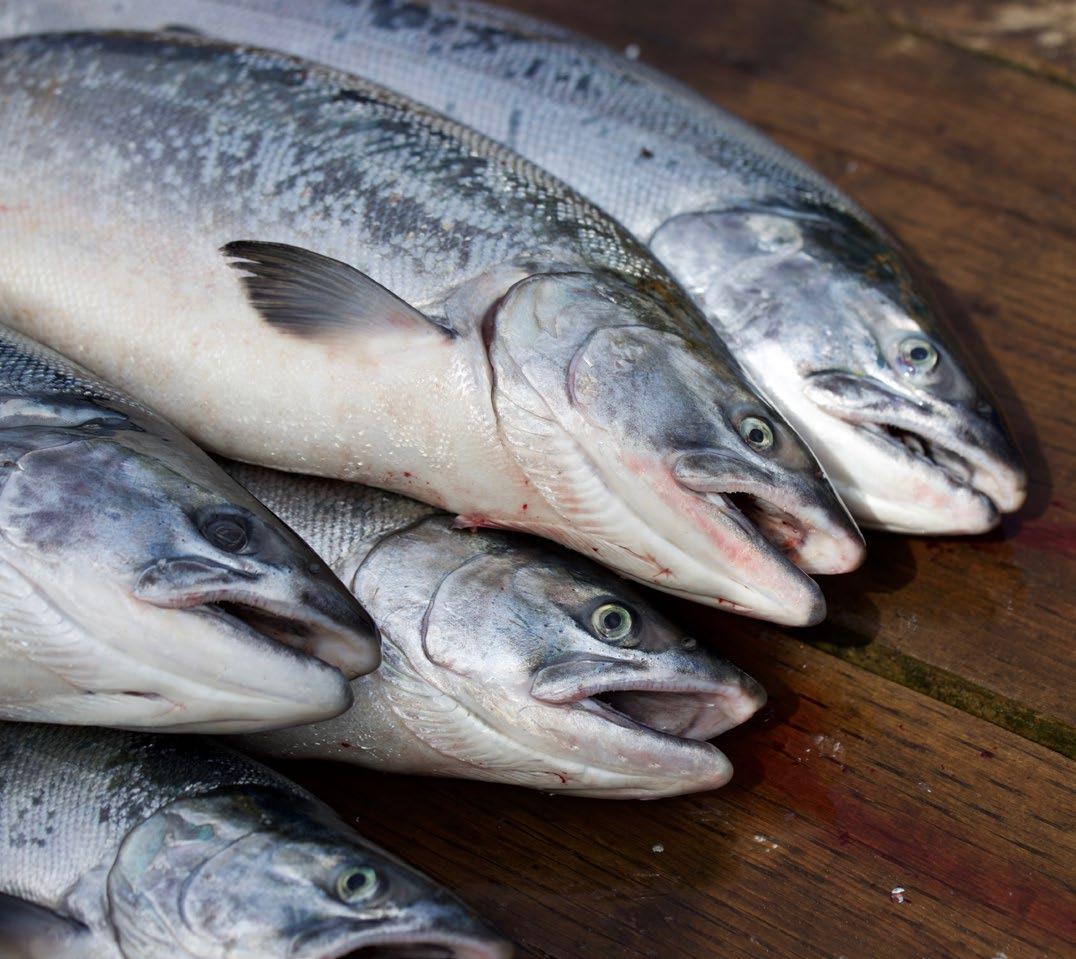
ture (represented in Figure 1). To date, the majority of research in fish using GM-derived oils rich in n-3 LC-PUFA has predominantly focused on Atlantic salmon (Salmo salar). This is largely due to the fact that salmonids are the primary consumer of extracted fish oils given the energy dense feeds required for farming, as well as its high-end value. Therefore, it is of paramount importance that the potential effects of using such substitutes are investigated. Consequently, oils derived from both omega-3 rich Camelina and Canola (Event NS-B50027-4) have been successfully trialed in several life stages. Freshwater fingerlings fed either 4 or 8% high n-3 GM Canola oil (9.3% omega LC-PUFA) exhibited similar growth and survival to those fed a diet containing fish oil as the main dietary lipid source when cultivated at either 12 or 16 oC. In seawater, no difference
Studies so far have focused on the use of the oil.
in growth were found in smolts fed a Camelina oil rich in either EPA or EPA + DHA (23.9% and 16.7% omega-3 LC-PUFA, respectively) compared to those fed a fish oil rich diet.
Moreover, all trials showed that the fish fed the GM-derived oils had enhanced levels of n-3 LC-PUFA in their flesh compared to either a commercial diet control or a feed containing wildtype Camelina, while also decreasing the omega-6:omega-3 ratio. For example, salmon fed a diet containing high omega-3 LC-PUFA Camelina oil accumulated almost double the amount of these health beneficial fatty acids as salmon fed a fish oil diet. Evidently, these enhanced levels can contribute to bridging the gap between demand and supply and help meet the 500 mg/ day intake requirement for omega-3 LC-PUFA in order to attain optimal cardiac health. Enhanced flesh levels
ARTICLE
of EPA + DHA has been a common finding in other studies where teleost fish were fed omega-3 LC- PUFA vegetable oils such as other fatty species including rainbow trout (Oncorhynchus mykiss), but also gilthead sea bream (Sparus aurata) and sea bass (Dicentrarchus labrax)
In addition to the benefits that the use of these oils can have for consumers, the use of vegetable oils rich in omega-3 LC-PUFA can also have added benefits for the fish such as reduced liver fat infiltration and hepatocyte area relative to fish fed feeds containing wildtype Camelina. Perhaps, most importantly to note is that none of the trials performed to date have reported any adverse effect in fish fed these novel oils thus demonstrating the potential for the exploitation of this key raw material. Studies so far have focused on the use of the oil, whereas the seed cake has yet to be tested as an alternative protein source. Additional processing of the seeds
such as dehulling or solvent extraction might be required to concentrate the protein fraction which in turn will increase the price as well as the environmental footprint of the product.
The validation of these novel oils as safe and effective substitutes for oceanic-derived fish oils was a key step in derisking this technology and helping it advance to market. In addition, increased awareness of issues associated with sustainability and environmental footprint have added impetus to commercialization. Exciting, two Canola events developed by BASF/Cargill and Nuseed/CSIRO have been deregulated by USDA and now can be cultivated at scale. These events represent the most complex metabolic engineering in plants to have been approved for commercial cultivation to date, although these developments represent the culmination of 25 years of fundamental research followed by
a concerted focus on development. Simultaneously, oil from the lead Camelina event has been used extensively in human studies, confirming the utility of this oil in both indirect (i.e., animal) and direct human nutrition.
There are also efforts to combine a number of different traits to produce a multifunctional crop tailored to the needs of e.g. aquaculture, combining the EPA + DHA trait with other high value components of aquafeed diets such as the antioxidant and pigment astaxanthin, which can be made in a number of different transgenic hosts and has been independently validated as a novel ingredient in fish feeding trials. Similarly, the amino acid composition and seed storage proteins can be enhanced to make the resulting protein composition more suitable for fish nutrition (e.g. by the inclusion of the cysteine derivative, taurine) as has been achieved in transgenic soybean. Equally importantly, it is possible to use gene editing to remove compounds such as glucosinolates which can act as feeding deterrents for some fish species. On this basis, it is possible to envisage a tailor-made cultivation ideotype specifically designed for the nutritional needs of both the fish and the human consumer whilst also delivering to the requirements of operating within planetary boundaries and leaving a lighter environmental footprint on our planet.
Recent analysis confirms the significant variance between demand for omega-3 long chain PUFAs and the available supplies from our oceans, currently estimated at providing only ⁓30% of the recommended levels of EPA and DHA for the global population. This highlights the pressing need for alternative supplies of these important fatty acids, not least of all given their health-protective role against cardiovascular disease and other metabolic pathologies which now blight the lives of many millions of people. In addition to the sustain- able syn-
The seed cake has yet to be tested as an alternative protein source.
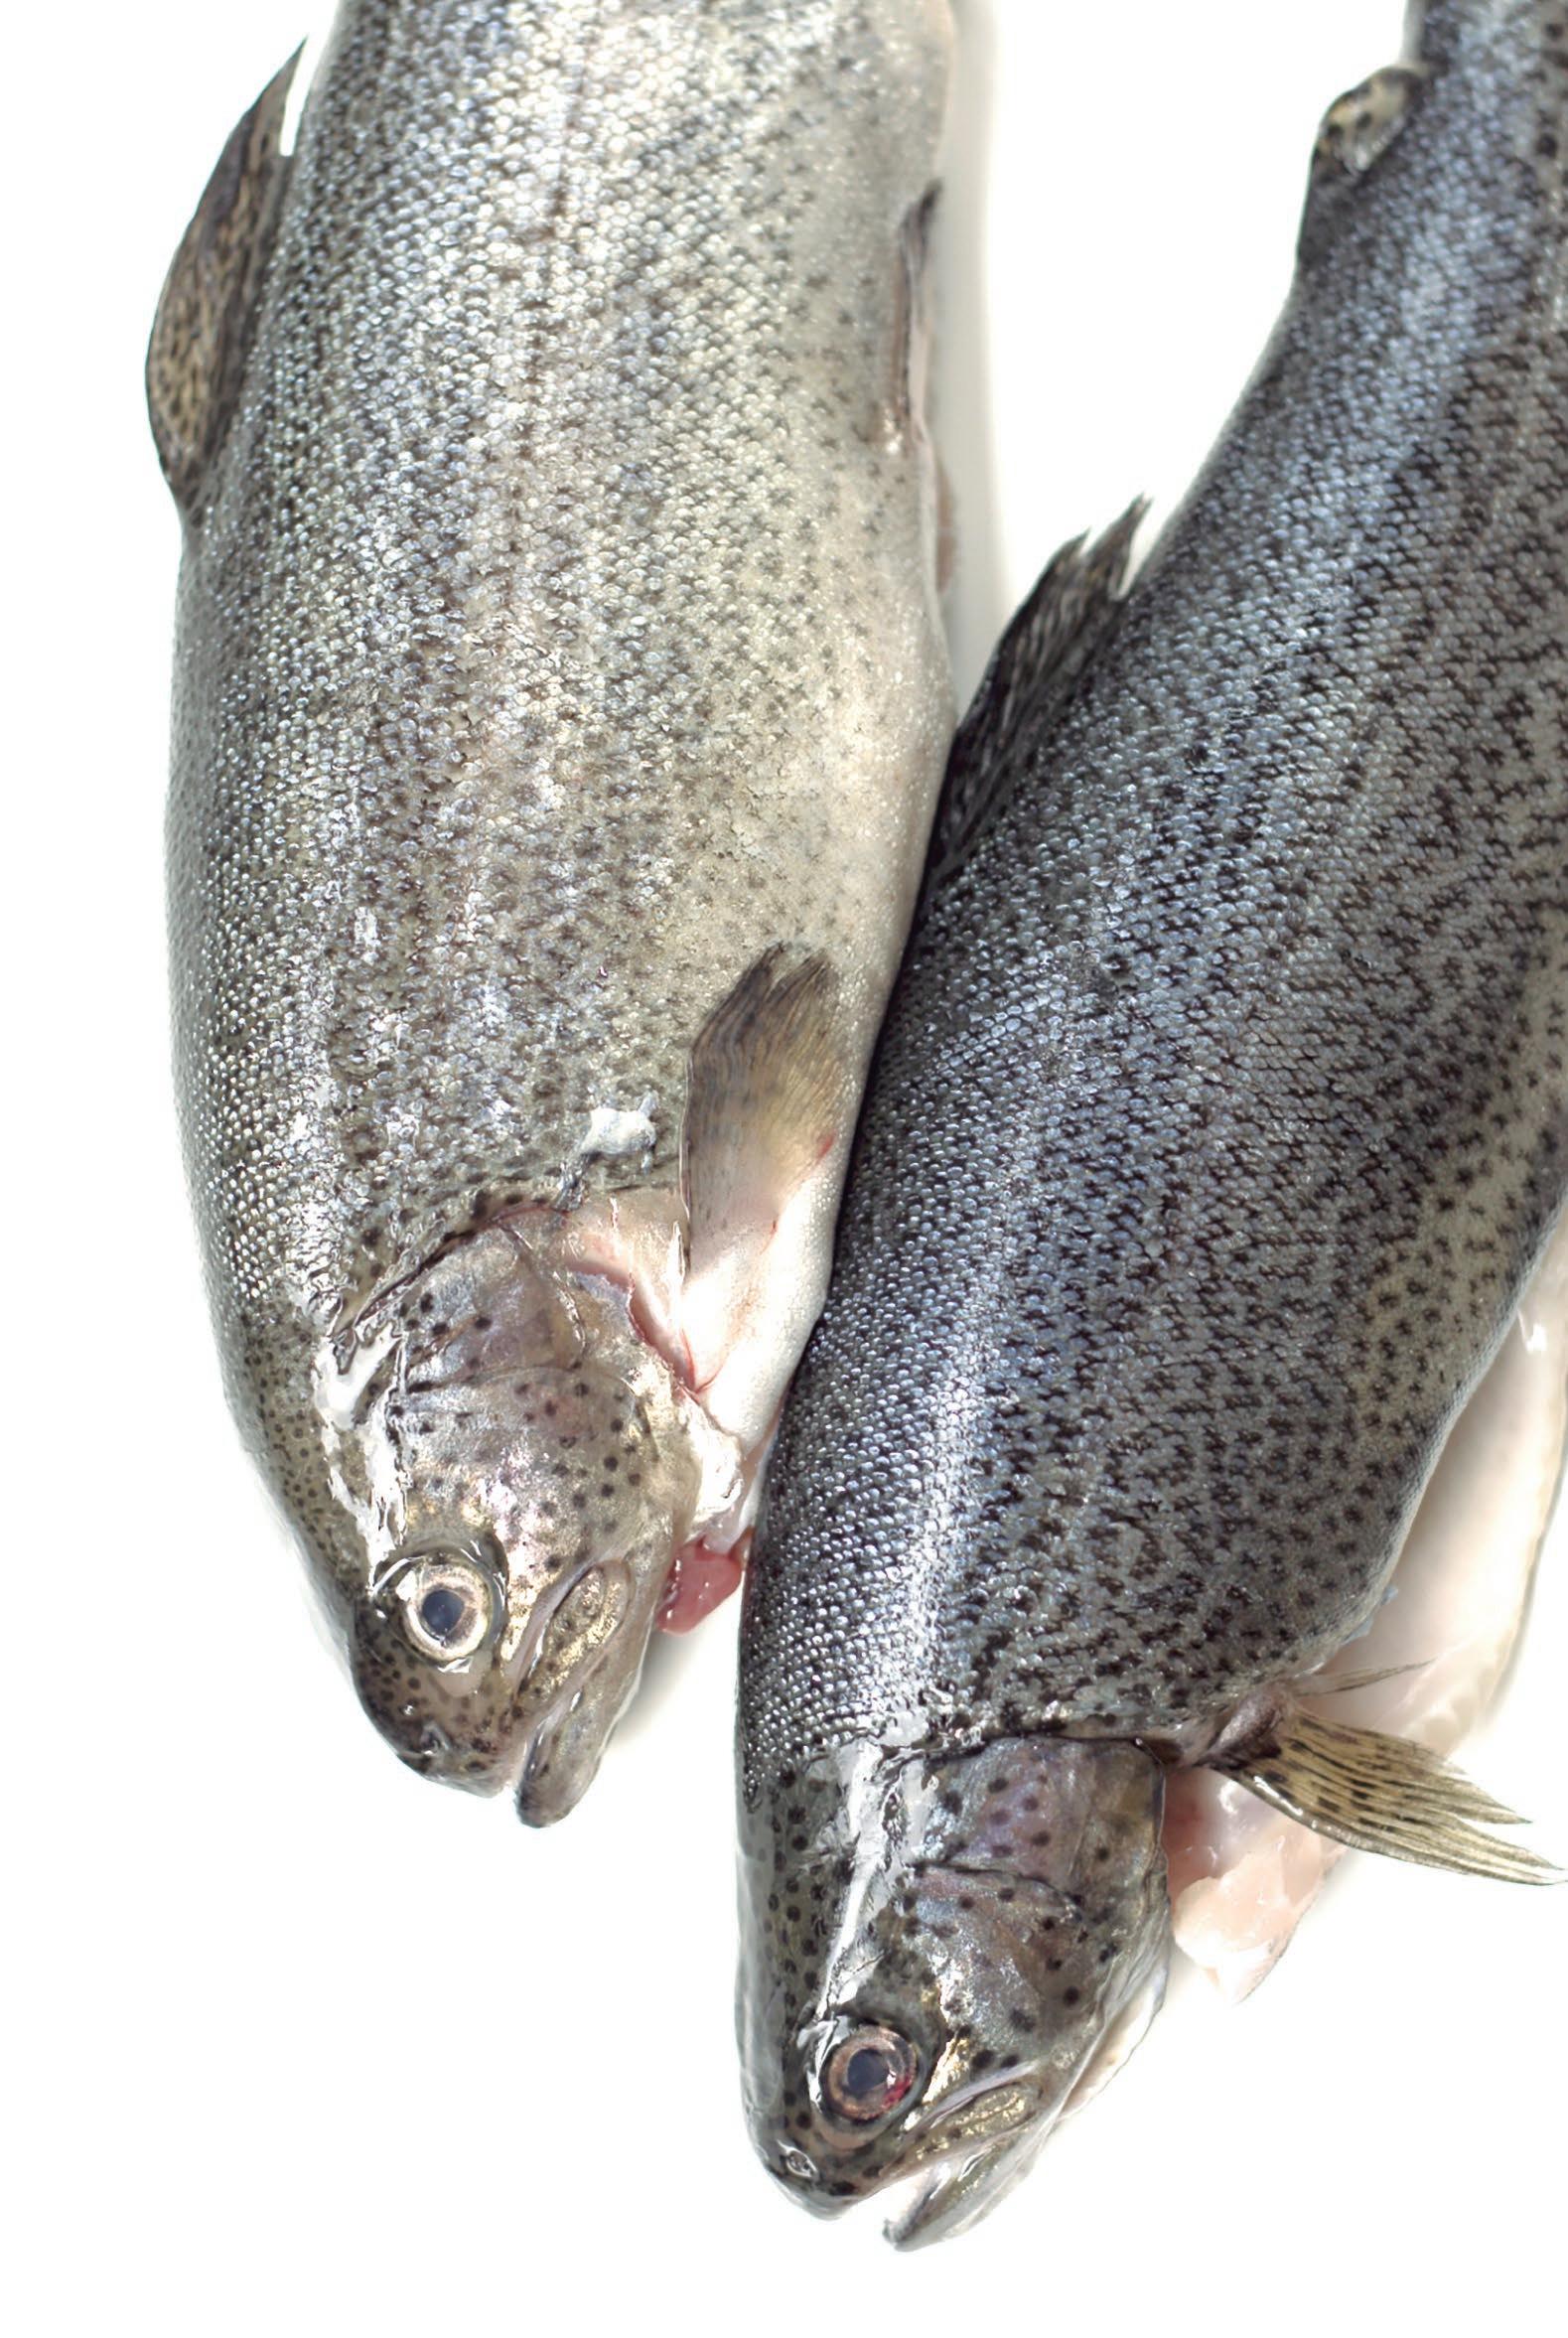
thesis of EPA & DHA via transgenic plants, a number of microbial (predominantly algae) systems are being established and also following the same path of validating these novel oils via aquafeed trials. One advantage of using algal-derived omega-3 PUFAs is that these strains are usually not GMOs, making their regulatory approval and consumer acceptance relatively straightforward. However, the largescale culture of algal strains remains a challenge, in terms of economics and infrastructure.
Moreover, almost all commercial algal platforms rely on heterotrophic growth (i.e., cultured using an exogenous carbon source which itself is invariably of vegetable origin, such as sugar cane) and this is not always fully reflected in sustainability declarations and it would be interesting to carry out a life cycle analysis of the different production systems to allow the consumer to make an informed choice with regard to environmental footprint. Other sources of LC-PUFA such as krill oil are now mainstream ingredients in aquafeed, although their inclusion is normally limited mainly due to its high price. Another approach to boost the levels of these health-beneficial fatty acids in fish without impacting on fisheries is the use of finishing diets high
in LC-PUFA. Although the novel plant platforms described above are GM with the associated regulatory burdens, they have the advantage of utilizing the pre-existing infrastructure and know-how which underpin modern agriculture, allowing rapid scaling and incorporation into production cycles. Expanding our use of plant-derived feed and foodstuffs will be essential for operating within planetary boundaries and collectively we need to embrace a different approach to ensuring optimal nutrition for all e plant biotechnology can play a key role in enabling this. As such, it is important to consider all ethical aspects of using GM-derived ingredients, including the impact of not adopting these innovations.
This is a summarized version developed by the editorial team of Aquaculture Magazine based on the review article titled “ENGINEERING PLANT-BASED FEEDSTOCKS FOR SUSTAINABLE AQUACULTURE” developed by: NAPIER, J.-Rothamsted Research; BETANCOR, M.-University of Stirling. The original article was published, including tables and figures, on FEBRUARY, 2023, through PLANT BIOTECHNOLOGY. The full version can be accessed online through this link: https://doi.org/10.1016/j.pbi.2022.102323.
What gets you to open the emails that land in your inbox or to click on an advertisement that appears in your social media feed? Perhaps you are drawn to humor or to images of practical applications for products. Now, consider how you develop your own online marketing. For instance, if there are yellow call-to-action (CTA) buttons on your website how did you select that color?
You may have relied on generalized statistics or personal preferences when initially developing your business website or email newsletters. As you generate and collect data on conversion, bounce, or open rates, or begin to spend marketing dollars

What gets you to open the emails that land in your inbox or to click on an advertisement that appears in your social media feed? Perhaps you are drawn to humor or to images of practical applications for products. Now, consider how you develop your own online marketing.
on social media advertising, the value in optimizing all aspects of your online presence becomes apparent. You want your marketing budget to be spent wisely and effectively and this is where A/B Testing can assist.
The principle of A/B Testing is similar to that of partial budgeting; it allows for the comparison in performance and effectiveness from making one change. As stated by Go (2022), “The premise behind A/B Testing is
comparing the performance of two or more variations to identify how different marketing strategies or activities perform with an audience. It’s designed to improve user experience (UX) and increase conversion rate optimization (CRO).”
To illustrate, imagine that you are running a Facebook ad campaign and it is not generating the number of click-throughs that you would like. For the ad, you initially used an image
of the product by itself, but you now speculate that an image of someone using the product would be more visually appealing, prompting greater a number of Facebook users to click on the ad. This type of situation is ideal for performing A/B Testing.
There are numerous elements of your online presence that you can experiment with through A/B Testing. A selection of elements is outlined below and categorized by marketing tool.
Website
9 Call-to-action (CTA) buttons: size, color, placement, and text.
9 Social media sharing buttons: placement, size.
9 Headings: color, text, and size.
9 Content: format (text, image, video, audio), text font size, style, placement, and structure.
9 Video/Images: different composition and placement.
9 Product descriptions: inclusion of reviews, format.
9 Forms: amount and type of information requested.
9 Use of Image/video: text only vs. with image or video, image vs. GIF, people in image, video length, number of images.
9 Hashtags: hashtag use vs. not, multiple vs. one, placement within the post.
9 Post text: length, style (quote, statistic, statement, question), emoji use, punctuation, tone (casual, formal, passive, active).
Email/Email newsletters
9 Email subject lines: questions, statements, emoji use.
9 “From” name.
9 Send time.
9 Content: length, font size, style, placement, and structure/layout.
9 Video/Images: composition, placement.
9 Personalization.
9 Preview text.
9 Social media sharing buttons: placement, size.
Performing A/B Testing offers numerous benefits including:
9 Quick results.
9 Wide applicability to features of your online/digital presence.

9 Reduced risk from making untested changes.
9 Improved user engagement and experience (improving trust and customer retention).
9 Enhanced content.
9 Reduced bounce rates.
9 Greater conversion rates.
9 Higher conversion rate values.
9 Reduced cart abandonment.
9 Increased
9 A/B testing allows you to make data-driven decisions rather than decisions based on gut feel-
ings and personal preferences. Stated succinctly, “A/B Testing provides practical, tangible evidence of your most impactful marketing techniques” (Grayson, n.d.).
While there are a number of benefits to A/B Testing, there are also a few challenges to be aware of. As noted by Singh, V., Nanavati, B., Kar, A.K. et al. (2022), these include:
9 A/B Testing only works for specific goals. If the goal is difficult to measure, or unmeasurable, A/B Testing is not effective. As stated previously, A/B Testing is data-driven therefore you must have a variable that you can measure and track.
9 Long-term relevance. You must ask yourself if 6 or 12 months down the road whether the A/B
Test would generate the same results.
9 Continuous testing. These ties to the previous challenge. For long-term relevancy, marketing should be tested regularly. Unfortunately, many A/B Tests are once-and-done exercises.
9 Time and resource-heavy. Since you are only testing one variable at a time, if you have numerous variables to test it could take quite a while to perform all of the desired A/B Tests. The slow nature of this process can see testing-related expenses accumulate quickly.
Suggested processes for performing an effective A/B Test include the following steps which closely align with the scientific method (Figure 1).
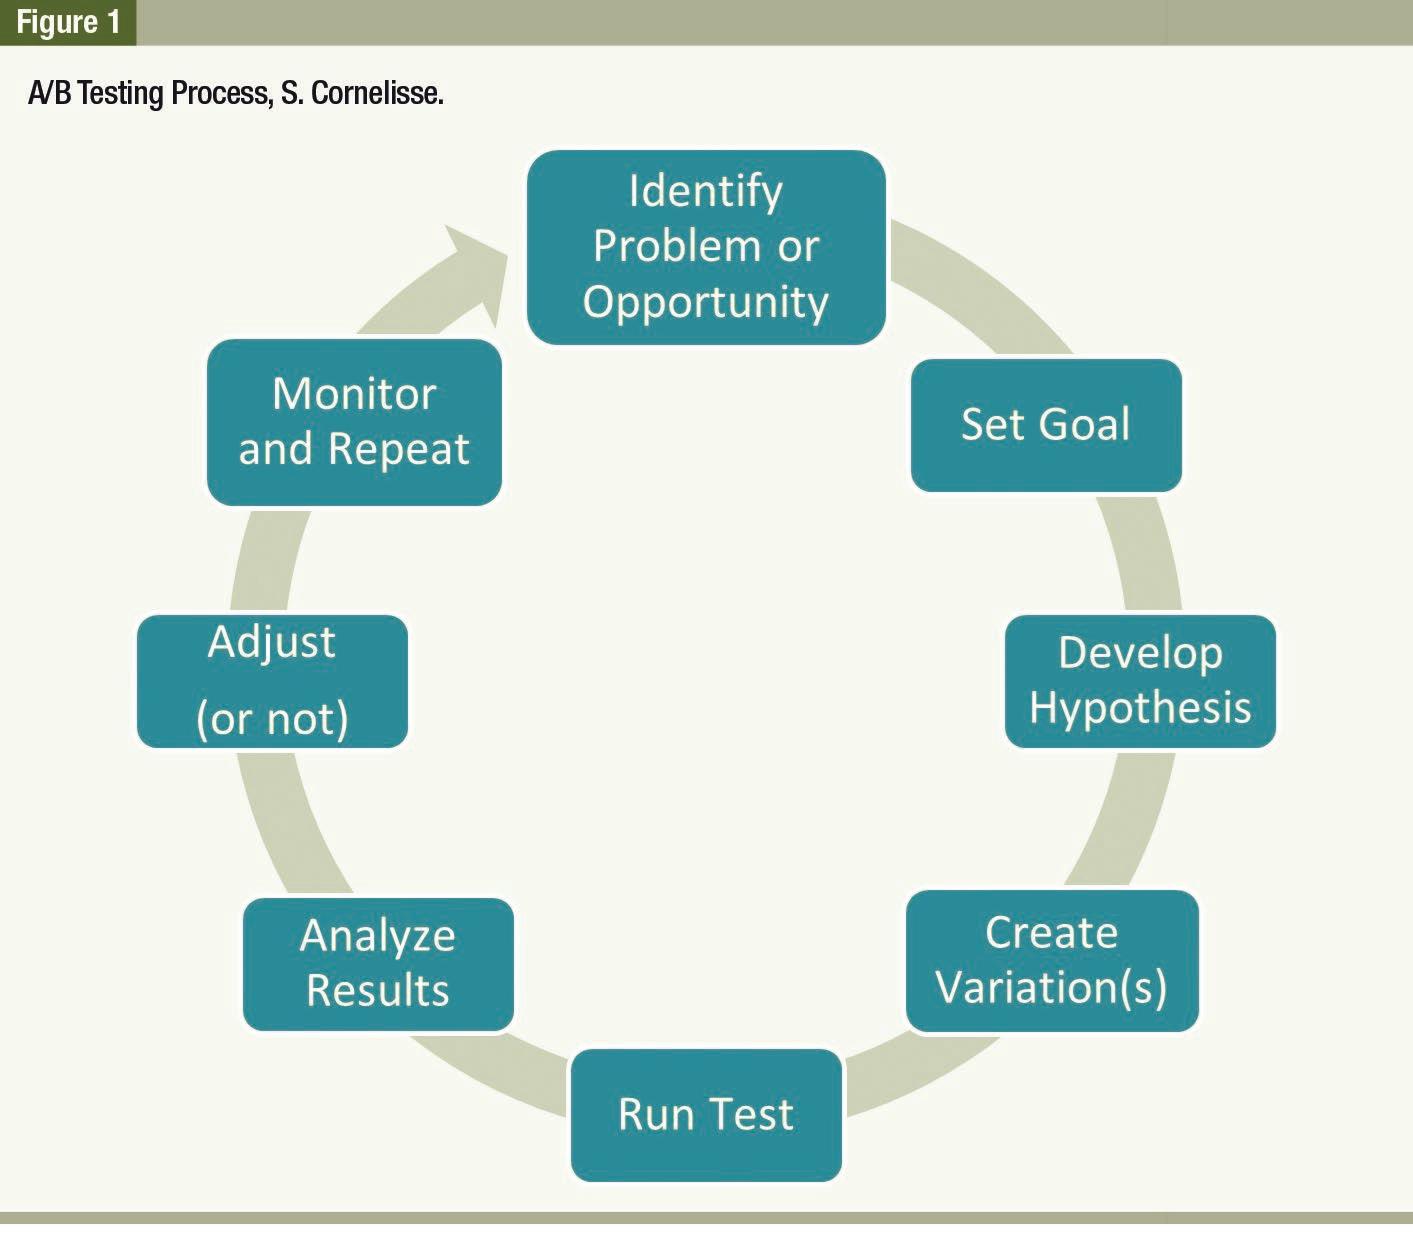
1. Identify the problem/opportunities for improvement.
2. Set/know goals.
3. Develop a theory/hypothesis.
4. Create variation(s).
5. Run test(s).
6. Analyze results.
7. Adjust (or leave alone).
8. Monitor and repeat.
As with any process, there are some best practices that will aid in the effectiveness of A/B Testing. These include:
9 Know your goals. Have a clear v ision for what it is that you want to accomplish in your business and online marketing. For instance, with social media is your goal brand awareness or sales maximization? What is it that you want consumers to do, or how do you want them to respond?
9 Have a clear question that you want to test. You need to be able to clearly articulate your hypothesis, how it will be measured, and how the outcome will help you better achieve your stated goals.
9 Test only one variable at a time. If you make more than one change, you can’t be certain which change the audience is responding to.
9 Prioritize testing variables to those that will have the greatest impact. To try to identify these, focus on bottle -
necks or pain points that your consumers are experiencing. Monitoring analytic data for your website, social media, and emails will allow you to identify aspects that are proving to be hurdles with your consumer audience.
9 Allow sufficient time for your tes t(s) to run. While A/B Testing offers the advantage of providing quick results, you must still run tests for an adequate length of time to allow for variations in consumer activity. For example, running a test on an aspect of your social media between Monday and Friday only when you know that a large percentage of your audience is active on the weekends will result in lower statistical significance.
9 Get ideas from others. As with many aspects of business planning and o peration, you can benefit from asking others (customers, social media audience, employees, etc.) for their input on what could be tested.
You want your marketing budget to be spent wisely and effectively and this is where A/B testing can assist.
In addition to the benefits and challenges that have been previously covered, there are some additional factors to consider when performing A/B Testing. The first is the cost of implementation. Most A/B Tests can typically be easily created, and a change implemented if test results indicate to do so. However, if either development of the test variation or change implementation requires changes to website code or significant additional work on the part of a hired marketing consultant, you should determine whether the benefit from performing the test will outweigh the additional costs.
A second consideration is the demographics of your audience. A study looking at eye tracking and A/B Tests for a social media marketing campaign discovered that men and women were attracted to different types of components (Nichifor, 2021). It is reasonable to believe that other demographics, such as the age of the consumer may affect the effectiveness of marketing characteristics that you consider for A/B Testing. Due to the potential for demographic differences, try to gather and include demographic data along with the data you are collecting to measure A/B Test performance.
Finally, different tools exist to use when performing A/B Testing. Social media platforms (Facebook, Instagram, etc.) offer A/B Testing functionality when creating advertisements. For websites, two options are Google Optimize and Optimizely. Most email marketing services (MailChimp, Constant Contact, etc.) also offer the ability to perform A/B Tests.
For business owners or marketing managers interested in optimizing their online marketing, A/B Testing is a relatively easy-to-implement method to use. “The goal of every A/B Test is to find what variant drives more engagement, and then implement that change” (Wingerberg, 2021). It may take time to discover the most effective variant and variants may perform differently with different audiences. Therefore, it is important to perform A/B Tests regularly, collect demographic data on your audience in addition to data for measuring your hypothesis, revisit tests that you previously performed, and stay abreast of marketing trends that influence consumers.

Where trade names appear, no discrimination is intended, and no endorsement by Penn State Extension is implied.
References cited by the author available under previous request to our editorial team.
*Sarah Cornelisse is a Senior Extension Associate of agricultural entrepreneurship and business management at Penn State University in the Department of Agricultural Economics, Sociology and Education. Sarah has expertise in direct marketing, valueadded dairy entrepreneurship and marketing, the use of digital and social media for agricultural farm and food business marketing, and business and marketing planning and decision making. Originally from New York State, she has a B.A in mathematics from the State University of New York at Geneseo, and M.S. degrees in Agricultural Economics and Animal Science, both from Penn State University. Correspondence email: sar243@psu.edu Editor’s note: references cited by the author within the text are available under previous request to our editorial team.

The principle of A/B testing is similar to that of partial budgeting
 By: Ph.D. Stephen G. Newman*
The Office International des Epizooties, known by the acronym OIE, was founded almost 100 years ago. In May 2003 it broadened its scope and changed its name to the World Organization for Animal Health (WOAH). Its stated mission is to ensure the transparent dissemination of animal health challenges with the goal of ensuring optimal animal health largely via education.
The Office International des Epizooties was founded almost 100 years ago. Its stated mission is to ensure the transparent dissemination of animal health challenges with the goal of ensuring optimal animal health largely via education. The question is: Are they fulfilling their mandate to help aquaculture become sustainable?
The end result one would expect is a sustainable industry with effective controls in place for minimizing the impact of disease on aquaculture. Although aquaculture has been practiced for a very long time it is only relatively recently that is has grown exponentially. Today many hundreds of fish species and a dozen or so species of crustaceans are being farmed with many more in various stages of R&D. Only re-
cently the tonnage of the biomass produced via aquaculture surpassed that of the wild fishery. Several species of fish, including Rainbow trout (Oncorhynchus mykiss) , Atlantic salmon (Salmo salar) , tilapia (Oreochromis species) , channel catfish (Ictalurus punctatus) and shrimp, including both tiger (Penaeus monodon) and white shrimp (P. vannamei) are being produced at levels that dwarf what is available through commercial fishing with no
The end result one would expect is a sustainable industry.
indication that production is slowing down. Diseases have large impacts on the sustainability of these production paradigms and OIEs mandate is intended to help mitigate this by preventing the movement of pathogens from infected areas to clean areas.
Many countries look to the OIE for guidance and direction as to how to address the presence of specific pathogens that the OIE has determined require regulatory oversight. Unfortunately, the process by which new pathogens are added is slow, too slow for this to be an effective system. By the time controls are adopted and put in place where feasible, production is usually seriously affected. Furthermore, because of rapid growth, many aspects of aquaculture are in a constant state of flux. Most shrimp farming takes place in underdeveloped countries. While oversight might be present to
some extent it is rarely up to the task of keeping pathogens out of existing production systems and ensuring that they do not become the source of new infections. There are several reasons for this.

What would appear to be a legitimate approach for generating primers for pathogen specific probes may be outdated and actually causing harm in some instances. An example of this is the presence of endogenous viral elements or EVEs. These are sequences of nucleic acid that incorporate into host DNA. When the population reproduces, these sequences are passed on. This is theorized to be an important step in how anti-viral tolerance/resistance comes about in crustaceans. If a primer nucleotide sequence overlaps with or is an EVE sequence and this is the standardized primer used to detect a given virus, and then the presence of the viral fragment in host DNA
would be interpreted as the actively pathogenic virus being present.
This means that when populations are being screened for the presence of the specific viral pathogens that OIE has deemed are obligate pathogens they can be reported as carriers when they are not. The parvovirus (among others), IHHNV, responsible for RDS, runt deformity syndrome is one of the viruses that have been characterized as producing these sequences. Crustaceans, via accommodation, develop RNAi mediated anti-viral activity. This appears to be the case for many of the shrimp viruses and could actually be for any virus that is present in stocks, whether pathogenic or not. This suggests that it is critical to ensure that the primer sequences used to detect viruses in shrimp are critically evaluated on a regular basis to ensure that they are indeed picking up virulent virus and not EVE artifacts.
Only recently the tonnage of the biomass produced via aquaculture surpassed that of the wild fishery.
New viruses are being discovered regularly. DNA screening of crustaceans has revealed large number of what are putative viral sequences. Many as of yet uncharacterized viruses are likely present, some of which are likely to cause problems in farmed shrimp. Given the current state of affairs, it is impossible to ensure that when problems occur, even if OIE is notified immediately, that OIE can react quickly enough to prevent new viral disease outbreaks from becoming another WSSV, EHP or EMS.
Many (most if not all) of the countries that are members of the OIE routinely fail to report notifiable pathogens despite being obligated ethically to do so. They are not going to report new pathogens if they are loath to report existing pathogens. This allows them to avoid the repercussions that they would encounter in order to deal with this. These can be minor or severe in the sense that even frozen product can be rejected because it is carrying OIE listed pathogens. This attitude ensures that many will continue to spread a pathogen of importance because they are not looking for it. There are no consequences except
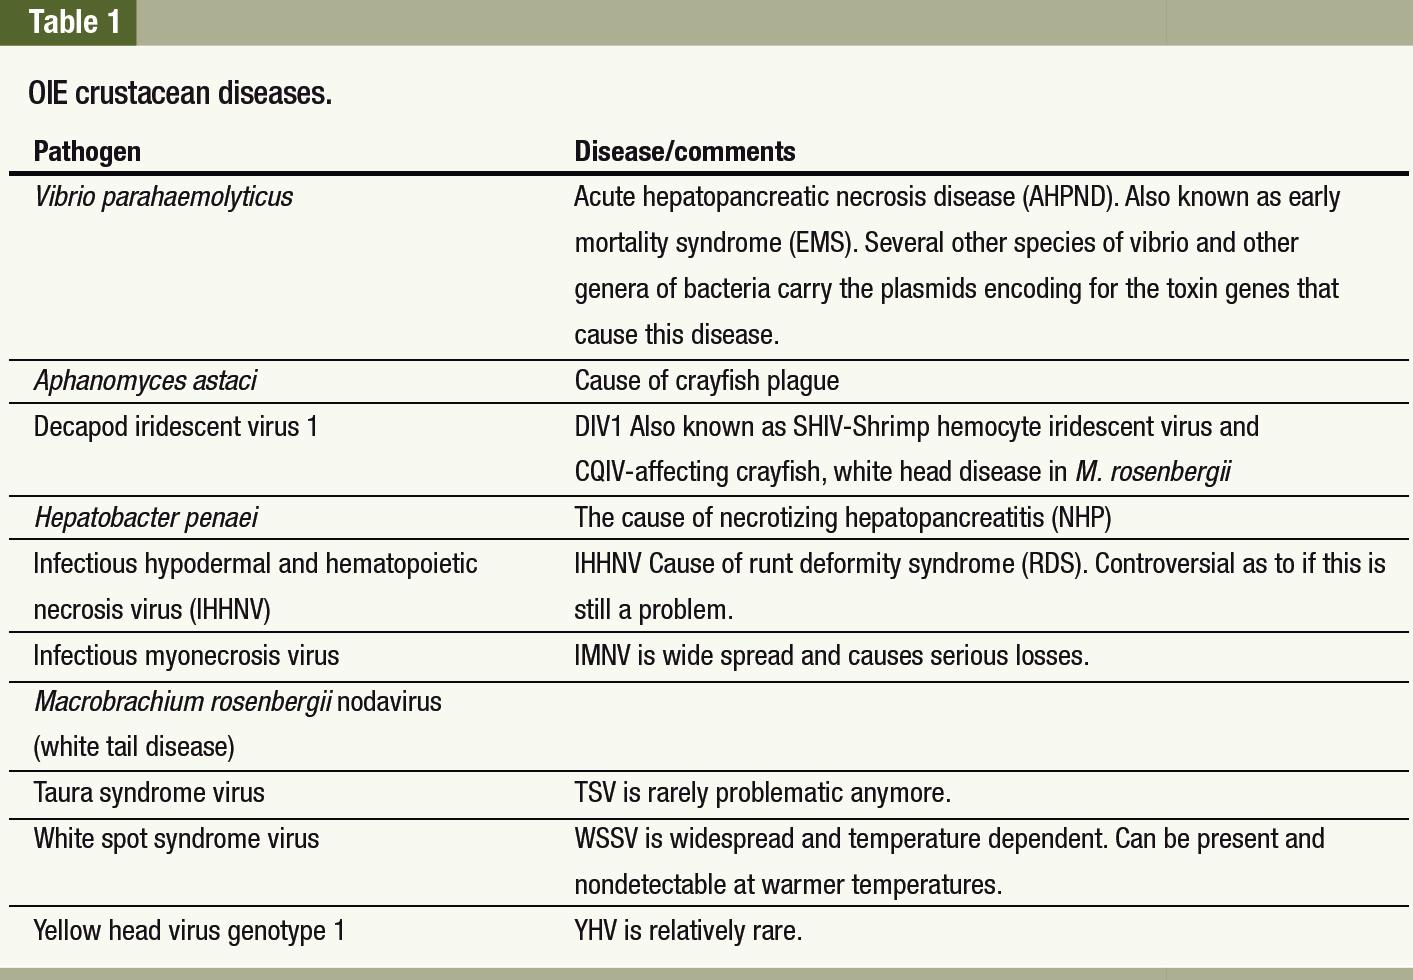
to the poor shrimp farmers either way.
Every company that produces broodstock for export is required to test their populations for a list of known pathogens in order to be able to legally export/import the animals. The OIE aquatic animal health code is a very important document for understanding the relative responsibilities of OIE and individual nations as it relates to aquatic animal health (https://www.woah.org/en/what-wedo/standards/codes-and-manuals/ aquatic-code-online-access/). As of this writing the list for shrimp (Table 1) includes the following pathogens:
There are a number of other pathogens that are not on the list and many workers in the field have pointed out that this along with the relative slow rate at which new pathogens are added undermines the credibility of OIE in terms of accomplishing its stated goals.
Today there are more than a dozen companies competing for the global broodstock business. While some countries are recognizing that the best and most secure approach is to limit these imports and focus on local production most still import screened animals often with some
form of limited quarantine. This ensures for the time being that they have access to the best animals, i.e., those strains that are domesticated, that grow faster, get bigger, convert better, tolerate stress, etc. Short term quarantine and random testing of a small percentage of the population for OIE pathogens opens the door for other pathogens to enter. The greatest degree of protection afforded to farmers entails the use of broodstock that have been produced according to CITES guidelines. They should have well established performance histories along with thorough repeat testing against all pathogens that there are primers for, regardless of OIE status, along with in-depth histopathology of target organs with the slides being read by a professional.
Screening of animals on a population basis is inadequate by itself for considering lines to be SPF. This is a statistical approach that while it may offer a high degree of statistical confidence that a given pathogen is not present is simply not adequate when one is dealing with millions and hundreds of millions of animals. At a 95% confidence interval, 50,000 out of a million PLs
can be carrying a pathogen. Individual screening of animals used to be prohibitive with the advent of new technology it is possible to test each individual, reducing this risk significantly (https://www.genics.com. au/). A multiple generation quarantine along with an in-depth examination of animals via histopathology for tell tale signs of the presence of uncharacterized pathogens must be a part of this process. Using the term SPF for animals without these cannot always typically provide the degree of protection needed to ensure sustainability. It ensures that problems will persist.
This is made even more challenging by the fact that some of the companies that produce what they claim are SPF animals are also claiming that this is because the animals are resistant to infection with the specific pathogens that they are screening for. They claim that the reason the population is SPF is because they are resistant to the pathogen being considered. While it is possible that SPF animals are “resistant”, this is not the reason for them being SPF. Determining that they are resistant or tolerant requires the ability to challenge naive animals and appropriate controls with the pathogens of interest via the established route of infection under controlled conditions. Truly resistant animals, which is a rarity if it occurs at all, cannot be infected by any route regardless of how stressed they may be. Tolerant animals can be infected although they have the ability to tolerate higher levels of exposure prior to developing acute disease. Tolerance appears to be common. Resistance appears to be rare.
SPF is not a snapshot of the population. It is the result of a many cycles process that ensures that the pathogens of interest are not present. The moment this cycle is broken the animals can not be considered
to be SPF. The reality is that when someone is buying SPF animals and they hold them in an environment where there are no or inadequate barriers to ensure that the pathogens of interest are not present and cannot infect animals that one cannot consider these animals to be SPF.
For OIE to be truly effective in preventing the spread of existing and newly characterized as well as yet to be characterized pathogens, their approach needs change. Manuals need to be updated frequently in response to the presence of new pathogens. Failing to reveal the presence of pathogens of interest in a country should have repercussions. There are none and many countries do not report that they have WSSV, EHP, EMS, etc. New diseases need to be reported as soon as they are discovered and steps need to be taken to include the pathogens in the OIE list as quickly as is possible. The responsibilities of members are clearly outlined in the current manual, Chapter 1.1 (https://www.woah. org/en/what-we-do/standards/ codes-and-manuals/aquatic-codeonline-access/?id=169&L=1&htmfi le=chapitre_notification.htm).
The fact that there are no repercussions for failing to report the presence of notifiable diseases ensures, in my opinion, that sustainable shrimp farming will continue to remain elusive well into the foreseeable future. As more researchers focus on specific pathogens, primer fine tuning is essential. Some viruses, notably RNA viruses, are much less stable than DNA viruses and have very high rates of mutation. They evolve quickly. It is critical that cutting edge tools and science be considered in determining which pathogens belong on the list, whether they should remain there and what can be done to eradicate them or at the very least mitigate their impacts to the maximum possible extent.
They are not going to report new pathogens if they are loath to report existing pathogens.
Organizations such as OIE are important for sustainable aquaculture. However, they need to recognize that they are constrained in this and that without the ability to ensure that endemic pathogens are reported and consequences for not reporting are commensurate with the offense, it is unlikely that they will be able to fulfill this role in the manner that the industry has to have if it is ever going to reduce the impact of disease on aquaculture.
Resource Management (ecology) and a Ph.D. from the University of Miami, in Marine Microbiology. He has over 40 years of experience working within a range of topics and approaches on aquaculture such as water quality, animal health, biosecurity with special focus on shrimp and salmonids. He founded Aquaintech in 1996 and continues to be CEO of this company to the present day. It is heavily focused on providing consulting services around the world on microbial technologies and biosecurity issues. sgnewm@aqua-in-tech.com

www.aqua-in-tech.com
www.bioremediationaquaculture.com www.sustainablegreenaquaculture.com
As we enter the New Year ‘The Fishmonger’ is wondering if we are going to see some innovation in promoting seafood and especially getting the consumers more engaged in purchasing more and obtaining more confidence.
The Fishmonger has been involved in many such promotional activities and there are three concepts which stand out. One of these is the ‘whole of country’ approach which needs many people in government and industry organizations coming together creating a road map to success. This can work but it needs a government who wants to engage with industry, many workshops and commitment of all the main players to make it happen. Whilst this is the best approach as it looks at how government policies impact as well as a focus on the full supply chain it is exceedingly difficult so in this article, we will highlight the other opportunities.
The second is getting a group focused on a harvested product. This is generally led by the harvester and involves a specific species and likely a branded product. The main beneficiary is the harvester but one of the failures here tends to be that the harvester tends to focus on their own ideas whereas if they expanded the opportunity for their processors, wholesalers, and retailers e.g., the supply chain to their consumers, to engage they would likely create better outcomes and learn so much more about their ‘chain’.
As we enter the New Year ‘The Fishmonger’ is wondering if we are going to see some innovation in promoting seafood and especially getting the consumers more engaged in purchasing more and obtaining more confidence.
There have been some highly successful promotional programs over the years but, unfortunately, they have
been dwarfed by so many failures and inconsistencies. Doing nothing either individually or collectively is not an answer as now the industry is not only up against other proteins for a share of the plate, but a plethora of man/laboratory made alternatives, some may say, fake foods aka known as plant-based alternatives. Do not ignore this it is happening right around us now!
Thirdly there is the very localized activity that can be created by every retailer. The Fishmonger was part of a team that won awards (state and national) for a program he was involved which engaged the local community, employing and training young local people (mainly young people), educating the consumers and building a friendly hub which enhanced the business and the community.
Many times, however, there is a sense of missed opportunities for seafood promotion and we are going to highlight one of those now. Note there is still a wonderful opening for organizations to en-
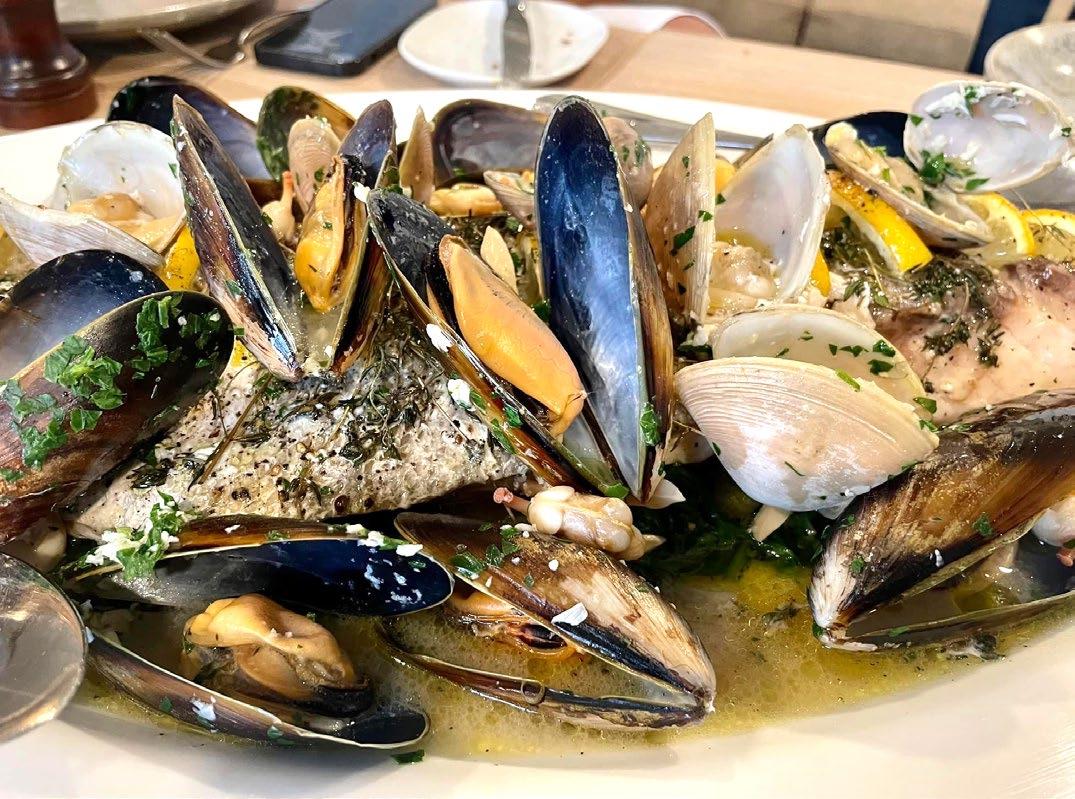
gage in this before this is totally lost so, please give the following a good viewing if you intend to start off the year with some innovative ideas.
John started casual work in the hospitality industry as a twelve year old in country New South Wales, Australia and has now been a chef for over 35 years and has an impressive background in Fine Dining, Restaurants, Hotels, Cafes, Catering Companies, First & Business Class Lounges and Schools, etc. He lists his specialties as people management, kitchen operations, market trends, mobilizations, menu planning, menu development, food cost control, supplier negotiations & relations, communication, profitability, mentoring & leadership.
He has brought all of his skills and unique experiences together to become the World Food Champion -Seafood and yet how many of you are aware? The seafood industry generally would not be cognizant, and thus they are seemingly blind to the opportunities that this could create. This where the seafood industry fails! Missing this is like missing a penalty in the World Cup…
John McFadden qualified with a golden ticket win in a qualifying round of the competition held in Australia. This secured his place in the World
Food Championships (WFC) at Fair Park in Dallas, Texas, USA last November. Overall, there were three hundred teams competing in ten category divisions of which forty were from countries outside USA and McFadden being the only Australian.
In the competition he got to the top ten cook-off in the Seafood division category after he came in second place in the first round on 11 November, where he competed against thirty other teams.
Do not ignore this, it is happening right around us now!
McFadden finally secured the title in the top ten cook-off for the WFC over the weekend of 12-13 November 2022. With an impressive score of 99.15 out of 100, he defeated the next closest challenger by over two points and making the win even more impressive was that he was cooking solo in the kitchen. Competition rules permit teams to compete, meaning all of his top ten competitors were multi-chef teams from around the world and across the United States. Truly an amazing effort!
As you would expect, the battle to become a category champion was an epic showdown of culinary talent and execution from around the globe. Amazingly every single category of the championship which occurred at Fair Park, Dallas, experienced a turnover in leadership as no reigning champion was able to defend his/her 2021 title.
The score on his first seafood final dish came in at 99.75. In the final (second dish) 40% of the first score was added to 60% of your second score for an overall average total between five judges. McFadden finished on 99.15 for both dishes. Simply awesome!
John’s first dish was shrimp/ prawn & snapper ravioli, pea puree, prawn butter & caviar. He relied on products available in Dallas for his seafood and used Ecuadorian Farmed
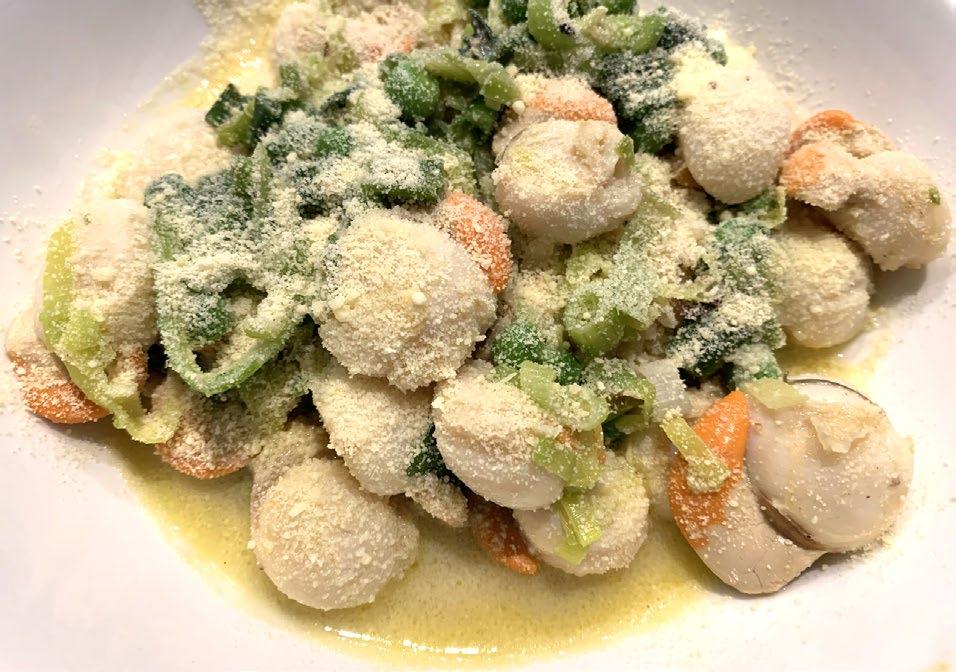
Shrimp with wild Red Snapper from Gulf of Mexico and wild scallops from New Bedford, Massachusetts.
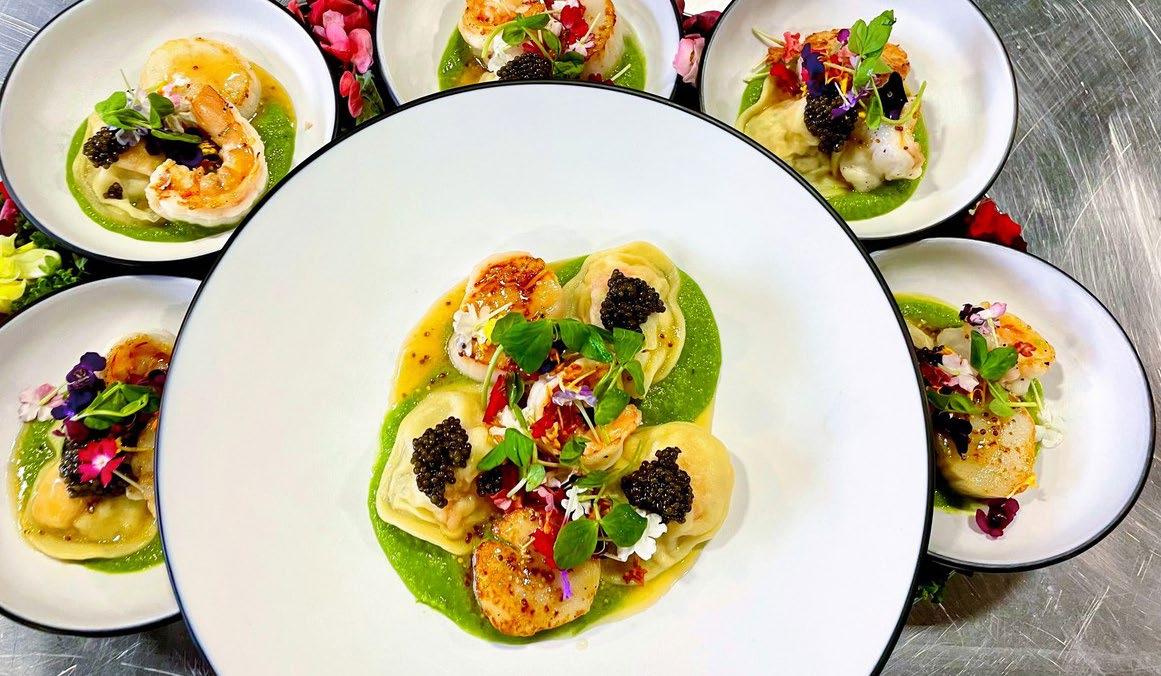
His second dish was confit salmon, baby beets, pickled cucumber & caspy caviar (caspy caviar is an ingredient required for the final). He used Scottish Farmed Wester Ross Salmon - Wester Ross Salmon is hand raised, fed, and harvested in the oldest Salmon farm in Scotland.
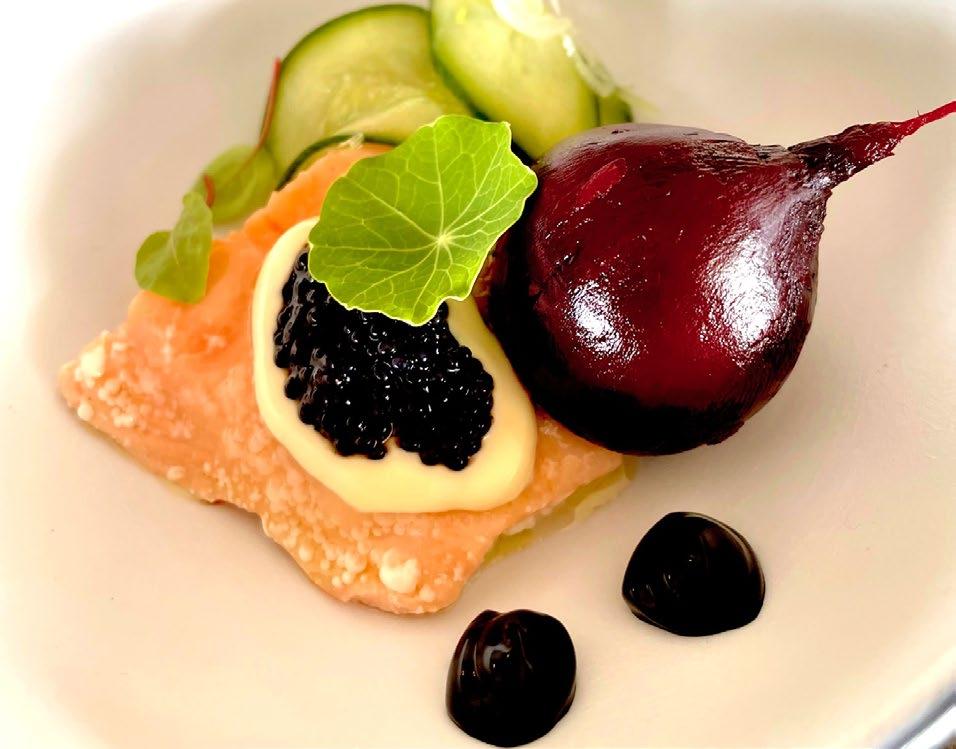
As an aside, the burger category was particularly challenging with five countries represented. Japan finished sixth, Canada claimed fourth, Dubai was third, and France climbed into second. But it was a former World Food Champion, Dave Elliott from Kansas, who shocked the field by claiming the title for USA.
This was Elliott’s second big win at WFC - the first was back in 2013 when Elliott swept the entire competition with his beloved mom’s carrot cake recipe. “It was my first year at the World Food Championships and I really had zero expectations that year,” he is reported as saying.
In this current competition, Elliott and his master crew of die-hard foodies came prepared to do battle against seasoned pros from across the globe. Going in, Elliott thought he might have a slight edge. “I think being a barbecue guy definitely came in
handy,” he says. “If you look at the list of competitors in all of the categories, you will see a lot of people from the barbecue world. We have had to learn to cook so many different things at barbecue contests. Plus, we know how to cook to a clock. You have to know how long it takes to make each element of your dish, whatever it is, and work backward so you know when you need to start this or start that.” Elliott’s winning burger: “Fresh ground
ribeye, chuck, and short-rib patty infused with hickory smoked bacon on a fresh-baked Brioche bun with lemon herb aioli and arugula,” he says. “I topped with gruyere, bourbon bacon jam, and a runny egg and served with fresh-made pickles.”
Elliott celebrated his world burger domination with his teammates. “I couldn’t have done it without them - John Magno, executive chef at District Pour House+Kitchen, and Dan McCall, owner of District Pour House+Kitchen, were my sous chefs,” he says. “Jenny Meyer-McCall managed the decorating of the presentation platters. They all did a fabulous job!” Note John McFadden secured his win solo!
It was reported that Mr. McFadden’s win shocked the WFC field, having entered the competition seeded at 107 in the world. In the seafood category, he defeated American Carol Koty, (currently working as Food & Beverage Director at Pomperaug Woods, Southbury, Connecticut, USA) who was number one seed for the entire tournament. It is unlikely he will be under-estimated again, with Mr. McFadden saying consistency is his hallmark feature and key to his success.
“Most teams had two or three chefs in the kitchen. They could not believe I was doing it on my own and how precise I was in the kitchen. They called me ‘a machine’,” said Mr. McFadden after his win.
Having won the seafood world title, Mr. McFadden goes through to the Final Table event to be held in Bentonville, Arkansas, USA from 18th to 21st May 2023. The WFC have branded this deciding challenge ‘The Ultimate Food Fight,’ where all category winners cook-off against each other for the position of top chef in the WFC. The ten champions (Bacon - Jodi Taffel from Altadena, California; BBQ - Sterling Smith from Scottsdale, Arizona; BurgerDave Elliott from Olathe, Kansas; Dessert - Bethany Boedicker from Galveston, Texas; Steak - Peter Armendariz from Rowena, Texas; Rice / Noodle - Dan Reighn from San Jose, California; Soup - Rocky Julianelle from East Haven, Connecticut; Sandwich - Damon Holter from Hudson, Wisconsin; Vegetarian - Casey Jones from Jacksonville, Florida and Seafood - John McFadden from Sydney,
NSW, Australia) will have to navigate three more cooking challenges before claiming the event’s $100,000 grand prize.
Getting to this point has seen the competition participation go from over 80,000 people/entrants to ten. Kudos to all those that have reached the Final Table event and especially to the ‘Mighty McFadden Machine’, who has got there solo pushing out the seafood barrow.
So where is the seafood industry here? Have they been supporting and promoting John along his incredible journey? Has the seafood industry even recognized that this is a wonder-
ful promotional opportunity staring them in the face and utilizing John as an ambassador in some way?
‘There is none so blind as those who do not want to see’ is a proverb that comes to mind so The Fishmonger hopes you read this, understand the opportunity, and start scrambling to see how you can engage with John McFadden and people like him.
Have a happy healthy and safe 2023!
JANUARY 2023
AQUACULTURE AND AQUAPONICS TRAINING FOR FOOD SECURITY AND CLIMATE RESILIENCE 2022-2023
Nov 2022 – Feb 2023
La Paz, BCS, México.
E: talleres.acuaponia@cibnor.mx
W: https://www.cibnor.gob.mx/eventos-cibnor/3319-aquacultureand-aquaponics-training-for-food-security-and-climateresilience-2022-2023
FEBRUARY 2023
AQUAEXPO 2023, SANTA ELENA
Feb 8-9, 2023
Ecuador
T: +593 4 268 3017 ext.124 y 130
E: cjauregui@cna-ecuador.com cmosquera@cna-ecuador.com
W: https://aquaexpo.com.ec/santaelena/
SEAGRICULTURE CONFERENCE ASIA-PACIFIC 2023
Feb 8-9, 2023 (OnLine)
T: +31 85 401 73 97
E: info@dlg-benelux.com
W: https://seagriculture-asiapacific.com/
AQUAFARM
Feb 15-16, 2023
Pordenone, Italia
T: +45 70 22 19 10
W: www.aquafarm.show
AQUACULTURE AMERICA 2023
Feb 23-26, 2023
New Orleans, USA
T: (+1) 760.751.5005 FAX (+1) 760.751.5003
E: worldaqua@was.org
W: www.was.org
MARCH 2023
18th NORTH ATLANTIC SEAFOOD FORUM
March 7th to 9th 2023
Bergen, Norway
T: +47 481 14 196
E: andre@nor-seafood.no
W: https://nor-seafood.com/
SEAFOOD MARKETPLACE FOR NORTH AMERICA
March 12-14, 2023
Boston, Massachusetts,USA
T: +1 (800) 803-5804
E: seafood@onpeak.com
W: https://www.seafoodexpo.com/north-america/?gclid=Cj0KCQ iAic6eBhCoARIsANlox843RoOayWRsvN_hUFMUA2X_ajOit0Dsu_ dHublcqw04CiNKUeOU86saAqgYEALw_wcB
ACUICULTURA OFF-SHORE
March 13-29, 2023
Islas Canarias, Spain
T: +34 928 424 600
E: consultas@spegc.org
W: https://www.spegc.org/formacion-y-eventos/acuicultura-offshore/
AQUAFUTURE SPAIN, INTERNATIONAL AQUACULTURE INDUSTRY SHOW
March 28-30, 2023
Santiago de Compostela, Spain
E: okeventos.juan@gmail.com
W: www.aquafuturespain.com
AQUASUR TECH 2023
March 29-30, 2023
Punta Arenas, Chile
T: +569 81888565
E: info@aquasur.cl
W: www.aquasurtech.cl/
APRIL 2023
LATIN AMERICAN & CARIBBEAN AQUACULTURE 2023 (LAQUA 2023)
April 18-21, 2023
Panama City, Panama
T: (+1) 760.751.5005 FAX (+1) 760.751.5003
E: worldaqua@was.org y carolina@was.org
W: www.was.org
SEAFOOD EXPO GLOBAL/SEAFOOD PROCESSING GLOBAL
April 25-27, 2023
Barcelona, Spain
E: sales-global@seafoodexpo.com; customerservice@divcom.com
W: https://www.seafoodexpo.com/global/
MAY 2023
WORLD SEAFOOD INDUSTRY (WSI)
May 17-19, 2023
Guadalajara, Jalisco, Mexico
T: +52 473 756-0678; 52 (55) 7028 33 35
E:francisco.martinez@hfmexico.mx
thorsten.hofmann@hfmexico.mx
W: https://hfmexico.mx/worldseafood/
SEPTEMBER 2023
GLOBAL SHRIMP FORUM
Sept 5-7, 2023
Utrecht, Netherlands
W: https://www.shrimp-forum.com/
AERATION EQUIPMENT, PUMPS, FILTERS AND MEASURING INSTRUMENTS, ETC
DELTA HYDRONICS LLC.................................................................9
T: 727 861 2421
www.deltahydro.com
THE ROYAL VAN BEEST GROUP......................................................1
www.greenpin.com
ANTIBIOTICS, PROBIOTICS AND FEED ADDITIVES
BAJA AGRO INTERNATIONAL......................................BACK COVER
Privada Kino Este No. 100A-1 Parque Industrial Misión Ensenada, Baja California, Mexico CP 22830
www.yucca.com.mx
SÓMA..........................................................................................17
24, Hanbul-ro 69 Beon-gil, Eumseong-eup, Eumseong-gun, Chungcheongbuk-do 27698, Korea
E-mail : somafeednadditive@gmail.com
T: 043-878-0591
www.ssoma.co.kr
EVENTS AND EXHIBITIONS
AQUACULTURE AFRICA AFRAQ 2023.............INSIDE BACK COVER November, 13-16, 2023.
Mulungushi International Convention Centre (MICC). Lusaka, Zambia.
Tel: +1 760 751 5005
E-mail: worldaqua@aol.com
www.was.org
AQUACULTURE AMERICA 2023......................INSIDE BACK COVER February, 23-26, 2023.
New Orleans Marriott. New Orleans, Louisiana.
Tel: +1 760 751 5005
E-mail: worldaqua@aol.com
www.was.org
LACQUA 2023.................................................INSIDE BACK COVER
April, 18 - 21, 2023.
Hotel Riu Plaza,Panama City, Panama.
Tel: +1 760 751 5005
E-mail: worldaqua@aol.com
www.was.org
WORLD AQUACULTURE..................................INSIDE BACK COVER
May 29 to June 1, 2023.
Darwin Convention Centre. Darwin, Northern Territory, Australia.
Tel: +1 760 751 5005
E-mail: worldaqua@aol.com
www.was.org
REEFER CARGO
MSC..............................................................................................5
T: +52 55 5091 7070
www.msc.com/seafood
AQUACULTURE MAGAZINE......................................INSIDE COVER
Design Publications International Inc.
401 E Sonterra Blvd. Sté. 375 San Antonio, TX. 78258, USA
Office: +210 504 3642
Office in Mexico: +52(33) 8000 0578 - Ext: 8578
Subscriptions: iwantasubscription@dpinternationalinc.com
Sales & Marketing Coordinator. Juan Carlos Elizalde crm@dpinternationalinc.com | Cell: +521 33 1466 0392
Sales Support Expert, Abril Fernández sse@dpinternationalinc.com | Cell:+521 333 968 8515
PANORAMA ACUÍCOLA MAGAZINE
Empresarios No. #135 Int. Piso 7 Oficina 723
Col. Puerta de Hierro, C.P.45116 Zapopan, Jal. México
Office: +52 (33) 8000 0578
Contact 1: Subscriptions
E-mail: suscripciones@panoramaacuicola.com
Office: +52 (33) 8000 0629 y (33) 8000 0653
Contact 2: Juan Carlos Elizalde, Sales & Marketing Coordinator. crm@dpinternationalinc.com | Cell: +521 33 1466 0392
Contact 3: Abril Fernández, Sales Support Expert E-mail: sse@dpinternationalinc.com www.panoramaacuicola.com